Avicenna J Dent Res. 14(4):181-184.
doi: 10.34172/ajdr.2022.557
Original Article
Effects of Processing Delays in Different Coverages on the Image Quality of Photostimulable Phosphor Plates With Acteon and Digora Scanners
Roghieh Bardal 1, *  , Mahshid Mobini 1 , Nahid Hemmati 2
Author information:
1Department of Oral and Maxillofacial Radiology, Dental Caries Prevention Research Center, Qazvin University of Medical Sciences, Qazvin, Iran
2Dental Caries Prevention Research Center, Qazvin University of Medical Sciences, Qazvin, Iran
Abstract
Background: Delay in the processing of photostimulable phosphor storage plates (PSP) is a common occurrence in crowded clinics. Accordingly, the effects of processing delays in different coverages on the image quality of photostimulable PSPs were investigated with Acteon and Digora scanners.
Methods: Three Acteon (group A) and three Digora (group B) PSPs were used in this in vitro study. Each group had three subgroups according to three coverages, including protective box (A1, B1 ), semitransparent (A2, B2 ), and original dark case plates (A3 , B3 ). An aluminum step wedge was subjected to constant exposure conditions. The exposed plates were immediately processed with their corresponding scanner device (the golden standard), 5, 10, 20, 30, 40, and 60 minutes after exposure. The average gray level information of the 2nd, 5th, and 8th steps of the Al wedge was considered as the mean gray values (MGVs) of each wedge. The difference between the gray values of the 8th and 2nd steps was measured as image contrast.
Results: There was a significant difference between the contrast and MGVs of Acteon and Digora PSPs at all processing delay times (P<0.05). In general, there was no significant difference in the image MGVs and contrast between subgroups in any of the scanners (total P>0.05). In each subgroup, MGVs increased, while contrast decreased by increasing the processing delay time; the difference was significant except for the MGVs in the first 5 minutes of A1 (P=0.12) and A3 (P=0.06).
Conclusions: Thus, the type of scanner was effective on image quality; the type of PSP coating in the first few minutes could affect the rate of image quality loss. However, the scan time had a greater effect on the amount of image loss.
Keywords: Digital images, Dental radiography, Delayed scanning
Copyright and License Information
© 2022 The Author(s); Published by Hamadan University of Medical Sciences.
This is an open-access article distributed under the terms of the Creative Commons Attribution License (
http://creativecommons.org/licenses/by/4.0), which permits unrestricted use, distribution, and reproduction in any medium provided the original work is properly cited.
Please cite this article as follows: Bardal R, Mobini M, Hemmati N. Effects of processing delays in different coverages on the image quality of photostimulable phosphor plates with acteon and digora scanners. Avicenna J Dent Res. 2022; 14(4):181-184. doi:10.34172/ajdr.2022.557
Introduction
The quality of intra-oral images has a direct effect on diagnosis, treatment planning, intra‐operative control, and outcome assessment (1). Incorrect interpretation can potentially lead to unnecessary treatment (2). Phosphor storage plates (PSPs) are still widely used in dentistry due to their lower radiation dose, less time-consuming nature, the ability to be processed, modification, saving and transfer of images, and elimination of developing procedures (3).
The flexibility and size of PSPs were similar to those of conventional films. The low contrast detectability and exposure latitude of the photostimulable phosphor were superior to that of the film. Under different exposure times, clinically acceptable image quality was achieved with PSPs in comparison to the film, charge-coupled device, and complementary metal-oxide semiconductor sensors (4). Increased exposure latitude can compensate for both low and high exposures. Radiation dose is also reduced by low exposure compensation and depends on the PSP system (5).
The electrons trapped in F centers after exposure represent latent images but are metastable. The spontaneous emission of electrons has detrimental effects on the latent image and is proportional to the temperature, intensity, and duration of ambient light, which significantly reduces the signal and image quality (6). In busy clinics, scanning PSPs is not easy or possible immediately after exposure, and delay in processing can lead to the loss of important image information (7).
Image quality assessment is performed by examining the image quality for diagnostic purposes, and objective evaluation of the image is possible by calculating the mean gray values (MGVs) (8) and contrast.
Several studies have evaluated different waiting times in scanning PSP and achieved various results in this regard; density losses varied from 5 minutes up to 6 hours in different systems (9-13). However, the type of coatings and scanners or delay scanning times were different between these studies. Therefore, the current study sought to evaluate the effect of processing delays in different coverages on MGVs and the contrast of PSPs using Acteon and Digora scanners.
Materials and Methods
First, 3 PSP Digora and 3 Acteon PSP size 2 (30 × 40 mm) were used for this purpose. A 9-step aluminum (Al) step wedge with a purity of 99.5% and an incremental distance of 2 mm was also employed for the determination of the gray value and contrast measurements (Figure 1). Then, the effect of processing delays on MGVs and image contrast was evaluated under three types of coverage.
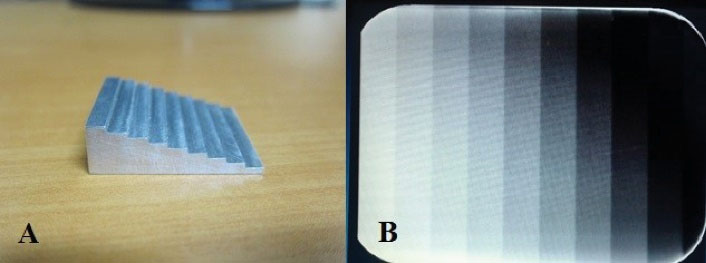
Figure 1.
(A) Aluminum Step Wedge With an Incremental Distance of 2 mm and (B) A Radiograph of the Step Wedge
.
(A) Aluminum Step Wedge With an Incremental Distance of 2 mm and (B) A Radiograph of the Step Wedge
PSPs were exposed to the X-ray machine (Mindray, Helsinki, Finland) with 2.5 mm thick Al filtration at 60 kVp, 10 mA, for 0.4 seconds, and source image distance (SID) of 32 cm. Next, they were exposed to step wedges each time under constant conditions.
The study had two main groups. The plates were scanned with the Acteon (Sopro, Ciotat Cedex, France) and Digora Optime (Soredex, PaloDex, Finland) systems in groups A and B, respectively (Figure 2).
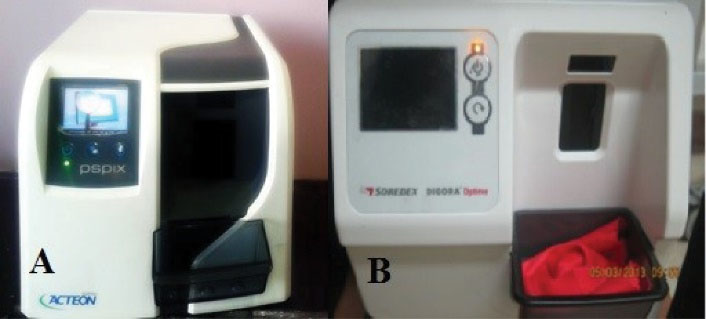
Figure 2.
(A) Acteon and (B) Digora Scanners Used in the Two Main Groups of the Study
.
(A) Acteon and (B) Digora Scanners Used in the Two Main Groups of the Study
Each group had three subgroups. The plates of groups A1 and B1 were kept in a light-protected box until processing, and those of groups A2 and B2 were placed in semi-transparent cases. In addition, the plates of groups A3 and B3 were placed in the original dark case provided by the respective manufacturer (Figure 3). The exposed plates were processed immediately with the appropriate scanner (the gold standard) 5, 10, 20, 30, 40, and 60 minutes after exposure, resulting in seven scan times for each subgroup and a total of 42 images.
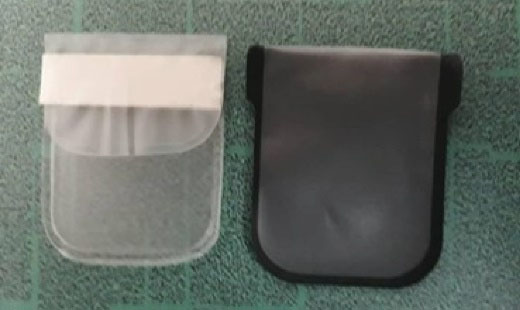
Figure 3.
(A) Light Protected Box and (B) Industry Supplier’s Semi-transparent Case and Original Dark Case
.
(A) Light Protected Box and (B) Industry Supplier’s Semi-transparent Case and Original Dark Case
The gray level information of the 2nd, 5th, and 8th steps of the Al wedge steps of all images was sampled by a maxillofacial radiologist with 14 years of experience by selecting a square whose dimensions were equal to the width of each step (ROI).
Black and white were assigned 0 and 255 by MGVs, respectively. Therefore, the difference between the gray values of 8th and 2nd steps was considered as image contrast.
Data were analyzed with SPSS (version 23) using ANOVA. One-way covariance analysis and t test were used for comparing groups and subgroups. The differences in contrast and MGVs of both groups in processing delay time and type of coverages were compared using the repeated measures statistical test, and the significance level was set at 0.05%.
Results
The MGVs of the plates were in the range of 110.71-125.05 and 106.74-122.78 for Groups A and B, respectively. The MGVs and mean contrast of the plates in groups A and B, according to delay in scanning time, are presented in Tables 1 and 2, respectively. There was a significant difference between the contrast and MGVs of Acteon and Digora PSPs at all processing delay times (P < 0.05).
Table 1.
Mean and Standard Deviation of MGV According to Protection Storage Conditions and Delaying Scanning Time
|
|
A
|
B
|
|
A1
|
P Value
|
A2
|
P value
|
A3
|
P Value
|
B1
|
P Value
|
B2
|
P Value
|
B3
|
P Value
|
| Tgold |
110.71 ± 61.7 |
|
110.71 ± 61.70 |
|
110.71 ± 61.70 |
|
106.74 ± 57.79 |
|
106.74 ± 57.79 |
|
106.74 ± 57.79 |
|
| T1 |
110.90 ± 61.83 |
0.12 |
111.80 ± 61.76 |
0.004 |
110.94 ± 61.73 |
0.06 |
107.90 ± 57.93 |
< 0.001 |
107.64 ± 58.26 |
0.002 |
107.97 ± 57.79 |
< 0.001 |
| T2 |
112.07 ± 61.41 |
< 0.001 |
112.44 ± 61.41 |
< 0.001 |
112.20 ± 61.38 |
< 0.001 |
108.73 ± 58.03 |
< 0.001 |
109.27 ± 57.53 |
< 0.001 |
108.88 ± 57.20 |
< 0.001 |
| T3 |
114.48 ± 62.36 |
< 0.001 |
114.36 ± 61.25 |
< 0.001 |
114.39 ± 61.81 |
< 0.001 |
110.75 ± 57.83 |
< 0.001 |
111.34 ± 57.49 |
< 0.001 |
112.13 ± 58.25 |
< 0.001 |
| T4 |
114.60 ± 62.31 |
< 0.001 |
116.88 ± 62.03 |
< 0.001 |
115.37 ± 62.21 |
< 0.001 |
113.92 ± 57.59 |
< 0.001 |
115.83 ± 58.23 |
< 0.001 |
113.62 ± 57.61 |
< 0.001 |
| T5 |
116.18 ± 62.17 |
< 0.001 |
118.94 ± 62.30 |
< 0.001 |
116.74 ± 62.30 |
< 0.001 |
115.18 ± 57.73 |
< 0.001 |
116.09 ± 5 8.73 |
< 0.001 |
116.75 ± 57.60 |
< 0.001 |
| T6 |
121.41 ± 62.86 |
< 0.001 |
125.05 ± 62.44 |
< 0.001 |
122.32 ± 62.69 |
< 0.001 |
120.40 ± 57.54 |
< 0.001 |
122.78 ± 56.94 |
< 0.001 |
121.94 ± 56.94 |
< 0.001 |
Note. MGV: Mean gray value.
Table 2.
Mean and Standard Deviation of Contrast According to Protection Storage Conditions and Delaying Scanning Time
|
|
A
|
B
|
|
A1
|
A2
|
A3
|
B1
|
B2
|
B3
|
| Tgold |
17.03 ± 3.5 |
|
17.03 ± 3.50 |
|
17.03 ± 3.50 |
|
27.68 ± 9.51 |
|
27.68 ± 9.51 |
|
27.68 ± 9.51 |
|
| T1 |
16.19 ± 3.58 |
< 0.001 |
15.98 ± 3.42 |
< 0.001 |
16.13 ± 3.34 |
< 0.001 |
26.82 ± 9.53 |
< 0.001 |
26.62 ± 9.52 |
< 0.001 |
26.83 ± 9.46 |
< 0.001 |
| T2 |
15.16 ± 3.49 |
< 0.001 |
14.93 ± 3.56 |
< 0.001 |
15.30 ± 3.54 |
< 0.001 |
25.81 ± 9.48 |
< 0.001 |
25.74 ± 9.47 |
< 0.001 |
25.55 ± 9.01 |
< 0.001 |
| T3 |
13.56 ± 3.07 |
< 0.001 |
13.39 ± 3.07 |
< 0.001 |
13.63 ± 2.94 |
< 0.001 |
23.80 ± 9.45 |
< 0.001 |
23.53 ± 9.64 |
< 0.001 |
23.84 ± 9.41 |
< 0.001 |
| T4 |
13.52 ± 3.05 |
< 0.001 |
10.40 ± 3.03 |
< 0.001 |
12.40 ± 2.68 |
< 0.001 |
21.25 ± 9.03 |
< 0.001 |
19.74 ± 9.46 |
< 0.001 |
21.00 ± 8.94 |
< 0.001 |
| T5 |
11.45 ± 2.96 |
< 0.001 |
8.63 ± 3.06 |
< 0.001 |
11.09 ± 2.64 |
< 0.001 |
19.34 ± 9.20 |
< 0.001 |
18.81 ± 9.14 |
< 0.001 |
19.19 ± 9.05 |
< 0.001 |
| T6 |
6.12 ± 2.24 |
< 0.001 |
3.32 ± 2.07 |
< 0.001 |
5.81 ± 1.95 |
< 0.001 |
14.78 ± 8.80 |
< 0.001 |
15.83 ± 11.46 |
< 0.001 |
14.31 ± 8.82 |
< 0.001 |
In each subgroup, MGVs increased, while contrast decreased with increasing scanning delay time. According to data in Tables 1 and 2, this difference was significant except for MGVs in the first 5 minutes (T1) of the protective box (A1, P = 0.12) and the original dark case (A3, P = 0.06) of the Acteon.
In general, no significant difference was observed in the image MGVs and contrast between subgroups in any of the scanners (total P > 0.05, Table 1).
Discussion
Today, digital radiology is widely used in dentistry due to its technological advancement (14). Considering the benefits of digital imaging, the replacement of conventional radiography with the digital imaging system even with a diagnostic accuracy similar to that of conventional radiography seems logical; the mentioned benefits include reducing the dose rate by 50%-90% compared to the conventional film, the possibility of processing and storing images, lack of a need for the image processing system, and faster preparation of images. Many studies evaluated the diagnostic quality and clinical performance of this system (14,15).
In this study, there was a significant difference between the image quality of both scanners in all processing delay times (P < 0.05); Digora images had higher contrast and lower MGVs in all delay times. However, the speed of the image loss was slower in Acteon images. In each subgroup, MGVs increased, while contrast decreased significantly by increasing the scanning delay time (P < 0.05), except for the MGVs in the T1 of A1 (P = 0.12) and A3 (P = 0.06).
Aktan et al studied the effect of the coating type and processing delay time in Dürr Dental and Digora Optime systems PSP plates were inserted and sealed in manufacturers’ original cases, black case, and white case. The MGVs of the processed images in Digora plates were not significantly different under the three coverages. A significant difference was found between the two scanners(5), which is in agreement with the result of the present study. However, the difference in MGV from the initial MGV of Digora plates in a 10-minute delay time was not significant. This disagreement can be due to differences in SID, initial exposure conditions, and ambient light in the two studies.
The results of the study by Akdeniz and Gröndahl (16) are in line with those of the present study in that MGV increased by increasing the processing time. The Digora plates were stored in a protective coverage that was placed in an opaque case on a dark shelf. The difference in storage conditions can explain the significant differences in MGVs at processing delays of more than one hour compared to images processed without a delay.
In their study, Akdeniz et al examined the effects of the processing delay under different storage conditions (the vicinity of light and light shield box) and different initial radiation doses on the quality of Digora plates (9). In line with the results of the present study, the MGVs of the images increased by increasing the processing delay time, and the only difference was that the increase in MGVs was significant at processing times longer than 10 minutes. This is perhaps because 10 minutes was the first delay time for measuring MGV in the mentioned study.
In another study by Eskandarloo et al, radiographic density did not significantly differ from baseline images after 10 minutes in Digora plates (17). The difference in the results can be due to the difference in the step wedge material and density measurement methods of the two studies.
The findings of Bramante et al contradict our findings in that processing after 120 minutes reduced image quality in Digora plates (6).The reason for this discrepancy is the difference in the method of image quality assessment and the object used for imaging. In the above-mentioned study, the quality of the dry human mandible image was visually graded by three observers, but the contrast ratio and MGV of the Al wedge image were numerically calculated in the present study.
Accordingly, image quality is reduced if the processing is delayed, and detection accuracy is reduced in cases such as caries detection where high image contrast is important (18). Finally, the effect of the processing time on image quality was more important than the type of applied coating.
Conclusions
In general, Digora images had better quality in all delay scanning times, but the speed of image loss was slower in Acteon; the type of PSP coverage in the first few minutes could affect the MGVs of the images; however, the scan time had a greater effect on the amount of image loss.
Author Contributions
MM and NH designed the study and performed the experiments. MM and BR collected and analyzed the data. RB supervised and wrote the paper.
Conflict of Interest Disclosures
The authors declare that they have no competing interests.
Ethical Statement
This study was approved by the Ethics Committee of Qazvin University of Medical Sciences (IR.QUMS.REC.1394.626).
References
- Patel S, Dawood A, Whaites E, Pitt Ford T. New dimensions in endodontic imaging: part 1 Conventional and alternative radiographic systems. Int Endod J 2009; 42(6):447-62. doi: 10.1111/j.1365-2591.2008.01530.x [Crossref] [ Google Scholar]
- Schweitzer DM, Berg RW. A digital radiographic artifact: a clinical report. J Prosthet Dent 2010; 103(6):326-9. doi: 10.1016/s0022-3913(10)00082-x [Crossref] [ Google Scholar]
- Yaghooti Khorasani MM, Ebrahimnejad H. Comparison of the accuracy of conventional and digital radiography in root canal working length determination: an invitro study. J Dent Res Dent Clin Dent Prospects 2017; 11(3):161-5. doi: 10.15171/joddd.2017.029 [Crossref] [ Google Scholar]
- Çalışkan A, Sumer AP. Definition, classification and retrospective analysis of photostimulable phosphor image artefacts and errors in intraoral dental radiography. Dentomaxillofac Radiol 2017; 46(3):20160188. doi: 10.1259/dmfr.20160188 [Crossref] [ Google Scholar]
- Aktan AM, Ciftçi ME, Akgünlü F. Comparison of the delay in processing time and protective plastic cases in two phosphor plate systems. ScientificWorldJournal 2012; 2012:850764. doi: 10.1100/2012/850764 [Crossref] [ Google Scholar]
- Bramante CM, Bramante AS, de Souza RE, Moraes IG, Bernardineli N, Garcia RB. Evaluation of the effects of processing delays and protective plastic cases on image quality of a photostimulable phosphor plate system. J Appl Oral Sci 2008; 16(5):350-4. doi: 10.1590/s1678-77572008000500009 [Crossref] [ Google Scholar]
- Nascimento HA, Visconti MA, Ferreira LM, Suarez MA, Haiter Neto F, Freitas DQ. Effect of delayed scanning on imaging and on the diagnostic accuracy of vertical root fractures in two photostimulable phosphor plates digital systems. Int Endod J 2016; 49(10):973-9. doi: 10.1111/iej.12547 [Crossref] [ Google Scholar]
- de Souza-Pinto GN, Santaella GM, Coli AA, Oenning AC, Haiter-Neto F. Analysis of the deterioration of photostimulable phosphor plates. Dentomaxillofac Radiol 2020; 49(6):20190500. doi: 10.1259/dmfr.20190500 [Crossref] [ Google Scholar]
- Akdeniz BG, Gröndahl HG, Kose T. Effect of delayed scanning of storage phosphor plates. Oral Surg Oral Med Oral Pathol Oral Radiol Endod 2005; 99(5):603-7. doi: 10.1016/j.tripleo.2004.10.021 [Crossref] [ Google Scholar]
- Martins MG, Haiter Neto F, Whaites EJ. Analysis of digital images acquired using different phosphor storage plates (PSPs) subjected to varying reading times and storage conditions. Dentomaxillofac Radiol 2003; 32(3):186-90. doi: 10.1259/dmfr/24355220 [Crossref] [ Google Scholar]
- Martins MG, Whaites EJ, Ambrosano GM, Haiter Neto F. What happens if you delay scanning Digora phosphor storage plates (PSPs) for up to 4 hours?. Dentomaxillofac Radiol 2006; 35(3):143-6. doi: 10.1259/dmfr/29710762 [Crossref] [ Google Scholar]
- Huda W, Rill LN, Benn DK, Pettigrew JC. Comparison of a photostimulable phosphor system with film for dental radiology. Oral Surg Oral Med Oral Pathol Oral Radiol Endod 1997; 83(6):725-31. doi: 10.1016/s1079-2104(97)90327-9 [Crossref] [ Google Scholar]
- Buchanan A, Benton B, Carraway A, Looney S, Kalathingal S. Perception versus reality-findings from a phosphor plate quality assurance study. Oral Surg Oral Med Oral Pathol Oral Radiol 2017; 123(4):496-501. doi: 10.1016/j.oooo.2016.12.004 [Crossref] [ Google Scholar]
- Melo DP, Pontual AA, Almeida SM, Campos PF, Tosoni GM. Alternative erasing times of the DenOptix system plate: performance on the detection of proximal caries. Oral Surg Oral Med Oral Pathol Oral Radiol Endod 2009; 107(1):122-6. doi: 10.1016/j.tripleo.2008.04.033 [Crossref] [ Google Scholar]
- Kashima I. Computed radiography with photostimulable phosphor in oral and maxillofacial radiology. Oral Surg Oral Med Oral Pathol Oral Radiol Endod 1995; 80(5):577-98. doi: 10.1016/s1079-2104(05)80155-6 [Crossref] [ Google Scholar]
- Akdeniz BG, Gröndahl HG. Degradation of storage phosphor images due to scanning delay. Dentomaxillofac Radiol 2006; 35(2):74-7. doi: 10.1259/dmfr/51534985 [Crossref] [ Google Scholar]
- Eskandarloo A, Yousefi A, Soheili S, Ghazikhanloo K, Amini P, Mohammadpoor H. Evaluation of the effect of light and scanning time delay on the image quality of intra oral photostimulable phosphor plates. Open Dent J 2017; 11:690-700. doi: 10.2174/1874210601711010690 [Crossref] [ Google Scholar]
- Sogur E, Baksi BG, Mert A. The effect of delayed scanning of storage phosphor plates on occlusal caries detection. Dentomaxillofac Radiol 2012; 41(4):309-15. doi: 10.1259/dmfr/12935491 [Crossref] [ Google Scholar]