Avicenna J Dent Res. 17(2):90-100.
doi: 10.34172/ajdr.2177
Original Article
Dysregulated Genes of the Epithelial Cell Development Pathway as Potential Mediators in the Pathogenesis of Oral Leukoplakia and Their Association With Head and Neck Squamous Cell Carcinoma
Devanshi Chhabria Formal analysis, Investigation, Project administration, Software, Writing – original draft, 1
Vijayashree Priyadharsini J Conceptualization, Data curation, Funding acquisition, Methodology, Resources, Supervision, Validation, Visualization, Writing – review & editing, 1, * 
Author information:
1Clinical Genetics Lab, Centre for Cellular and Molecular Research, Saveetha Dental College & Hospital, Saveetha Institute of Medical and Technical Sciences [SIMATS], Saveetha University, Chennai, India
Abstract
Background: Oral potentially malignant disorders (OPMDs) pose a significant risk for the development of oral cancer, particularly oral squamous cell carcinoma (OSCC), due to their tendency to exhibit dysplastic changes in the oral epithelium that can progress to malignancy. This study delved into the intricate gene expression profiles of oral leukoplakia tissues, explicitly focusing on unraveling potential biomarkers contributing to the advancement of OPMDs and OSCC.
Methods: The study successfully identified the top 20 differentially expressed genes (DEGs) by leveraging advanced techniques, such as RNA sequencing and bioinformatics analysis. The DEGs were further investigated by employing the TCGA dataset (HNSCC, Firehose Legacy). Multiple tools, such as STRING, Metascape, and Panther, were used for gene enrichment and ontology analysis.
Results: SLC7A11, CDSN, KRT24, and MSN were the notable genes that presented with the same expression profile among the two groups. Gene ontology and enrichment analysis revealed their crucial role in regulating oxidative stress, keratinocyte differentiation, and the motility of cancer cells. Among the four genes, SLC7A11, CDSN, and MSN were upregulated, and the fourth one, KRT24 was downregulated in both datasets. The upregulation of KRT24 and CDSN was found to correlate with good prognosis, while SLC7A11 and MSN were found to exhibit poor prognosis.
Conclusion: The study findings shed light on the possibility of these genes serving as early detection biomarkers and offering promising targets for therapeutic interventions. Additionally, the research emphasizes the need to explore further the genetic, epigenetic, and environmental factors influencing these expression patterns and validate these findings in clinical settings.
Keywords: Oral cancer, Keratin, Gene expression, Survival, Prognosis
Copyright and License Information
© 2025 The Author(s); Published by Hamadan University of Medical Sciences.
This is an open-access article distributed under the terms of the Creative Commons Attribution License (
https://creativecommons.org/licenses/by/4.0), which permits unrestricted use, distribution, and reproduction in any medium provided the original work is properly cited.
Please cite this article as follows: Chhabria D, Priyadharsini JV. Dysregulated genes of the epithelial cell development pathway as potential mediators in the pathogenesis of oral leukoplakia and their association with head and neck squamous cell carcinoma. Avicenna J Dent Res. 2025;17(2):90-100. doi:10.34172/ajdr.2177
Background
Cancer of the head and neck region, especially oral squamous cell carcinoma (OSCC), is increasing globally, notably in the Indian subcontinent and South-Central Asia (1). The global prevalence of the disease exhibits an alarming rise of 389 000 new cases annually. According to the GLOBOCAN report, the incidence is projected to increase by about 65% by 2050 if preventive measures are not developed for early disease management (2). Oral leukoplakia, characterized by white patches in the oral cavity, is a significant indicator of dysregulated epithelial cell development and potential malignancies. Oral potentially malignant disorders (OPMDs), such as leukoplakia, erythroplakia, proliferative verrucous leukoplakia, and oral submucous fibrosis, are conditions that can lead to the development of OSCC. The term “potentially malignant” has replaced “premalignant” to emphasize the severe risk of malignant transformation. It is important to note that patients with OPMDs are at a higher risk of developing oral cancer compared to those with healthy oral tissue. A systematic review that included 22 epidemiological surveys across the globe estimated the prevalence of OPMDs as 4.47%. Although a variation was observed in different populations, the prevalence was generally higher in Asian males (3). Chronic tobacco use, smoking, and alcoholism further increase the risk of developing dysplastic lesions. Chromosomal abnormalities, such as deletions and allelic imbalances, have been associated with the progression of epithelial dysplasia (4). Advancing technologies have brought in a wealth of information related to cancer stem cells and the reprogramming of normal cells, inevitably leading to malignant transformations (5). However, identifying a family of genes or an interacting network related to cancer phenotype or potentially malignant condition is quite rare.
A comprehensive study conducted by Porto et al reported the escalating prevalence of oral cancer among younger populations by recruiting OPMDs in two distinct age brackets. An extensive review of 640 lesions (1965-2020) demonstrated a reduction in OPMDs among individuals under 40, accompanied by a heightened prevalence of dysplastic and red lesions in older adults. Notably, the older age group exhibited a significantly greater propensity for smoking and alcohol consumption, unequivocally underscoring their correlation with an augmented risk of malignant transformation (6). Dysregulated genes within the epithelial cell development pathway play a crucial role in the development of this condition, often leading to an increased risk of progression to head and neck SCC (HNSCC) (7). Numerous biomarkers have been identified to be associated with OSCC; for example, the potential of vascular endothelial growth factor-A and cytokeratin-19 mRNAs in whole blood as biomarkers for early OSCC detection was assessed using real-time polymerase chain reaction. These mRNAs were significantly increased in OSCC patients compared to healthy controls. The combination of vascular endothelial growth factor-A and cytokeratin-19 showed a 60% predictive probability for OSCC, indicating promising diagnostic potential (8). However, few reports are available to identify common or early biomarkers related to OPMDs. Understanding the molecular mechanisms underlying these alterations in gene expression is essential for identifying early biomarkers and therapeutic targets. This exploration highlights the intersection between disrupted epithelial homeostasis and oncogenic transformations, providing insights into the early stages of cancer development and the overarching impact on oral health and disease management.
Computational analysis has enabled the rapid identification of biomarkers related to several disease conditions, including cancer. These markers pertained to a family of genes (9), interacting gene networks (10), epigenetic (11), transcriptomic, proteomic, or epi-transcriptomic (12) components closely associated with the investigated disease condition. The present study aims to analyze two exhaustive datasets to identify a “gene hub” common to both disease conditions. The study’s primary objective is to identify and curate the top 20 differentially expressed genes (DEGs) in the potentially malignant phenotype. The study’s secondary objectives are to compare the gene expression profile and select those genes exhibiting similar expression profiles in leukoplakia and primary tumor samples derived from HNSCC patients. In addition, the prognostic value of these genes is demonstrated using the Kaplan-Meier survival plotter to reveal their possible correlation with the survival of patients. The results gathered through this investigation can provide preliminary data to develop biomarkers that can be used for the early detection of oral cancer.
Materials and Methods
Sample Dataset
The GEOmnibus dataset GSE131568 hadfive fresh tissue samples fromoral leukoplakia patients (GSM3788671, GSM3788672, GSM3788673, GSM3788674, and GSM3788676) and six tissues from healthy oral mucosa (GSM3788677, GSM3788678, GSM3788679, GSM3788680, GSM3788681, and GSM3788682). A high-throughput RNA sequencing analysis was performed to compare both datasets. The adjusted P value was derived using Benjamini and Hochberg’s method. An adjusted P value lower than 0.05 was considered statistically significant. The log 2-fold change threshold was set at 0, and pseudogenes and non-coding RNAs were excluded from further analysis. Considering that it was exhaustive to include all DEGs, the number of genes for further investigations was limited to the top 20 (13,14).
Protein-Protein Interaction Analysis
The top 20 DEGs identified in the oral leukoplakia cases were evaluated for PPIs using STRING (Search Tool for the Retrieval of Interacting Genes/Proteins), version 12. The sources of interaction encompass text mining, experiments, databases, co-expression, neighborhood, gene fusion, and co-occurrence, each with a minimum score of 0.400. The PPI enrichment score assesses the observed interactions of the query protein against the entire proteome. A P value lower than 0.05 suggests that the observed interactions are statistically significant. This bioinformatics platform yields data on direct physical interactions and functional associations of proteins. Within the network, proteins are depicted as nodes, while the edges signify the type of interaction, whether physical, enzymatic, or genetic (15).
Gene Ontology Analysis
The PANTHER database (version 16.0, protein analysis through evolutionary relationships) was utilized for the gene ontology analysis of the curated DEGs in oral leukoplakia tissues. This comprehensive analysis allowed us to gain a deeper understanding of protein-coding gene families and their evolution, molecular pathways, functions, biological processes, and subcellular localization of gene products. A user-defined query of the top 20 genes was used to identify the pathways in which the genes were clustered. Additionally, pathway-based classification was performed to identify and explore potential pathways associated with the genes, contributing to a more comprehensive analysis(16,17).
Gene Enrichment Analysis
Metascape is a user-friendly web portal designed to help experimental biologists analyze and interpret large-scale biological datasets. It integrates diverse biological databases and analytical tools to identify critical pathways and protein complexes. Metascape simplifies the analysis process and provides precise results through functional enrichment, interactome analysis, and gene annotation. This makes it easier for researchers to compare data from different experiments. In our study, DisGENET analysis was employed to integrate various data types. The DEGs identified in oral leukoplakia tissues were submitted as a query and checked with the Homo sapiens database. This process was conducted to analyze the functional role of orthologous genes (18). The significance of this gene enrichment analysis cannot be overstated, as it helps us identify and understand the crucial biological pathways associated with the genes.
Gene Expression and Survival Analysis
The study analyzed the top 20 DEGs in oral leukoplakia tissues compared to normal healthy mucosa by employing the UALCAN (University of Alabama at Birmingham Cancer Data Analysis Portal) database (http://ualcan.path.uab.edu/cgi-bin/TCGA-survival) in HNSCC patients. The study involved 520 samples from patients with HNSCC and 44 paired normal samples. The expression profile was measured in transcripts per million, a standard unit for normalizing RNA-seq data. The significance between different groups was determined by creating box-whisker plots using the transcripts per million values. Additionally, the study demonstrated the overall survival of patients with HNSCC using Kaplan-Meier analysis. By comparing the high-expression and low/medium-expression groups, the study confirmed the effect of gene expression changes on patients’ overall survival (19). The Kaplan Meier Survival Plotter was further used to confirm the survival status of HNSCC patients upon changes in the gene expression profile of the selected gene, with similar expression patterns in both datasets (https://kmplot.com/analysis/) (20).
Statistical Analysis
The gene expression data from multiple datasets were rigorously analyzed using the powerful GEO2R tool, which effectively leverages R packages from Limma to meticulously examine the microarray data and present results in comprehensive tables and graphic plots (21). The UALCAN portal conducted a robust analysis of gene expression profiles by comparing expression levels between groups using a PERL script accompanied by the Comprehensive Perl Archive Network module. Additionally, survival plots were generated using the “survival” and “survminer” R packages and compared using the log-rank test. The “survival” package was exclusively utilized to perform thorough survival analysis, including survival curves, hypothesis tests, and models, while “survminer” significantly enhanced the visualization of Kaplan-Meier and forest plots, ensuring a clear and comprehensive representation and interpretation of complex survival data (22).
Results
Curation of Differentially Expressed Genes
The top 20 DEGs in oral leukoplakia tissues were selected from an array of genes, highlighting significant alterations in gene expression. Notably, SLC7A11 was highly upregulated, reflecting its increased activity in oral leukoplakia, which may suggest its role in oxidative stress defense and cell survival. The fold changes for these genes vary, with FLG2 (filaggrin 2) exhibiting the most substantial upregulation at 9.53-fold. Upregulated genes, such as SERPINB7 and CDSN, suggest that enhanced protein activity is linked to cell adhesion and immune response. Conversely, downregulated genes, such as SLC26A2 and SORL1, indicate decreased normal functions, potentially disrupting cellular transport and signaling processes. Genes KRT1, KRT10, and KRT24 show significant differential expression, suggesting that keratins, structural proteins essential for maintaining the integrity and function of epithelial tissues, may be involved in developing leukoplakia. KRT1 and KRT10 are upregulated, indicating an increased production of these keratins, which are typically involved in the differentiation of epithelial cells. This upregulation may reflect enhanced keratinization, a hallmark of leukoplakia, often characterized by thickened epithelial layers (Table 1). Conversely, KRT24 is downregulated, representing a potential disruption in specific keratinization pathways. This downregulation might indicate an abnormal cellular differentiation process or loss of normal epithelial function. These expression patterns may reveal vital molecular mechanisms underlying leukoplakia progression and offer potential therapeutic targets. The exceptionally low adjusted P-values across all genes underscore the reliability of these findings, pointing to robust and statistically significant changes in gene expression within the affected tissues (Figure 1a).
Table 1.
The List of the Top 20 Differentially Expressed Genes Identified in Oral Leukoplakia Tissues
|
Gene
|
Encoded Proteins
|
Fold Change
|
Gene Expression
|
Adjusted
P
Value
|
|
FLG2
|
Filaggrin 2 |
9.53 |
Upregulated |
0.00 |
|
SLC7A11
|
Solute carrier family 7, member 11 |
5.14 |
Upregulated |
1.28 x 10-228 |
|
SERPINB7
|
Serpin family B member 7 |
4.48 |
Upregulated |
4.63 x 10-183 |
|
CDSN
|
Corneodesmosin |
5.03 |
Upregulated |
2.96 x 10-181 |
|
LY6G6C
|
Lymphocyte antigen 6 family member G6C |
3.36 |
Upregulated |
2 x 10-175 |
|
SERPINB12
|
Serpin family B member 12 |
5.08 |
Upregulated |
1.1 x 10-168 |
|
FLG
|
Filaggrin |
7.52 |
Upregulated |
8.66 x 10-149 |
|
SLC26A2
|
Solute carrier family 26, member 2 |
-2.48 |
Downregulated |
4.33 x 10-141 |
|
SORL1
|
Sortilin related receptor 1 |
-1.76 |
Downregulated |
1.75 x 10-140 |
|
ABCA12
|
ATP binding cassette subfamily A member 12 |
2.64 |
Upregulated |
2.38 x 10-140 |
|
KRT1
|
Keratin 1 |
4.59 |
Upregulated |
1.18 x 10-134 |
|
LORICRIN/LOR
|
Loricrin cornified envelope precursor protein |
5.42 |
Upregulated |
2.96 x 10-130 |
|
AKR1B10
|
Aldo-keto reductase family 1 member B10 |
3.69 |
Upregulated |
1 x 10-128 |
|
TPPP3
|
Tubulin polymerization promoting protein family member 3 |
4.37 |
Upregulated |
6.96 x 10-127 |
|
KRT24
|
Keratin 24 |
-7.24 |
Downregulated |
3.82 x 10-126 |
|
NEFL
|
Neurofilament light chain |
4.35 |
Upregulated |
1.6 x 10-125 |
|
KRT10
|
Keratin 10 |
4.43 |
Upregulated |
6.24 x 10-123 |
|
GOLGA6L9
|
Golgin A6 family like 9 |
-2.99 |
Downregulated |
1.43 x 10-122 |
|
MSN
|
Moesin |
2.01 |
Upregulated |
1.49 x 10-121 |
|
RNLS
|
Renalase, FAD-dependent amine oxidase |
-2.59 |
Downregulated |
1.59 x 10-121 |
Note. *Antisense RNA, pseudogenes were excluded from the analysis.
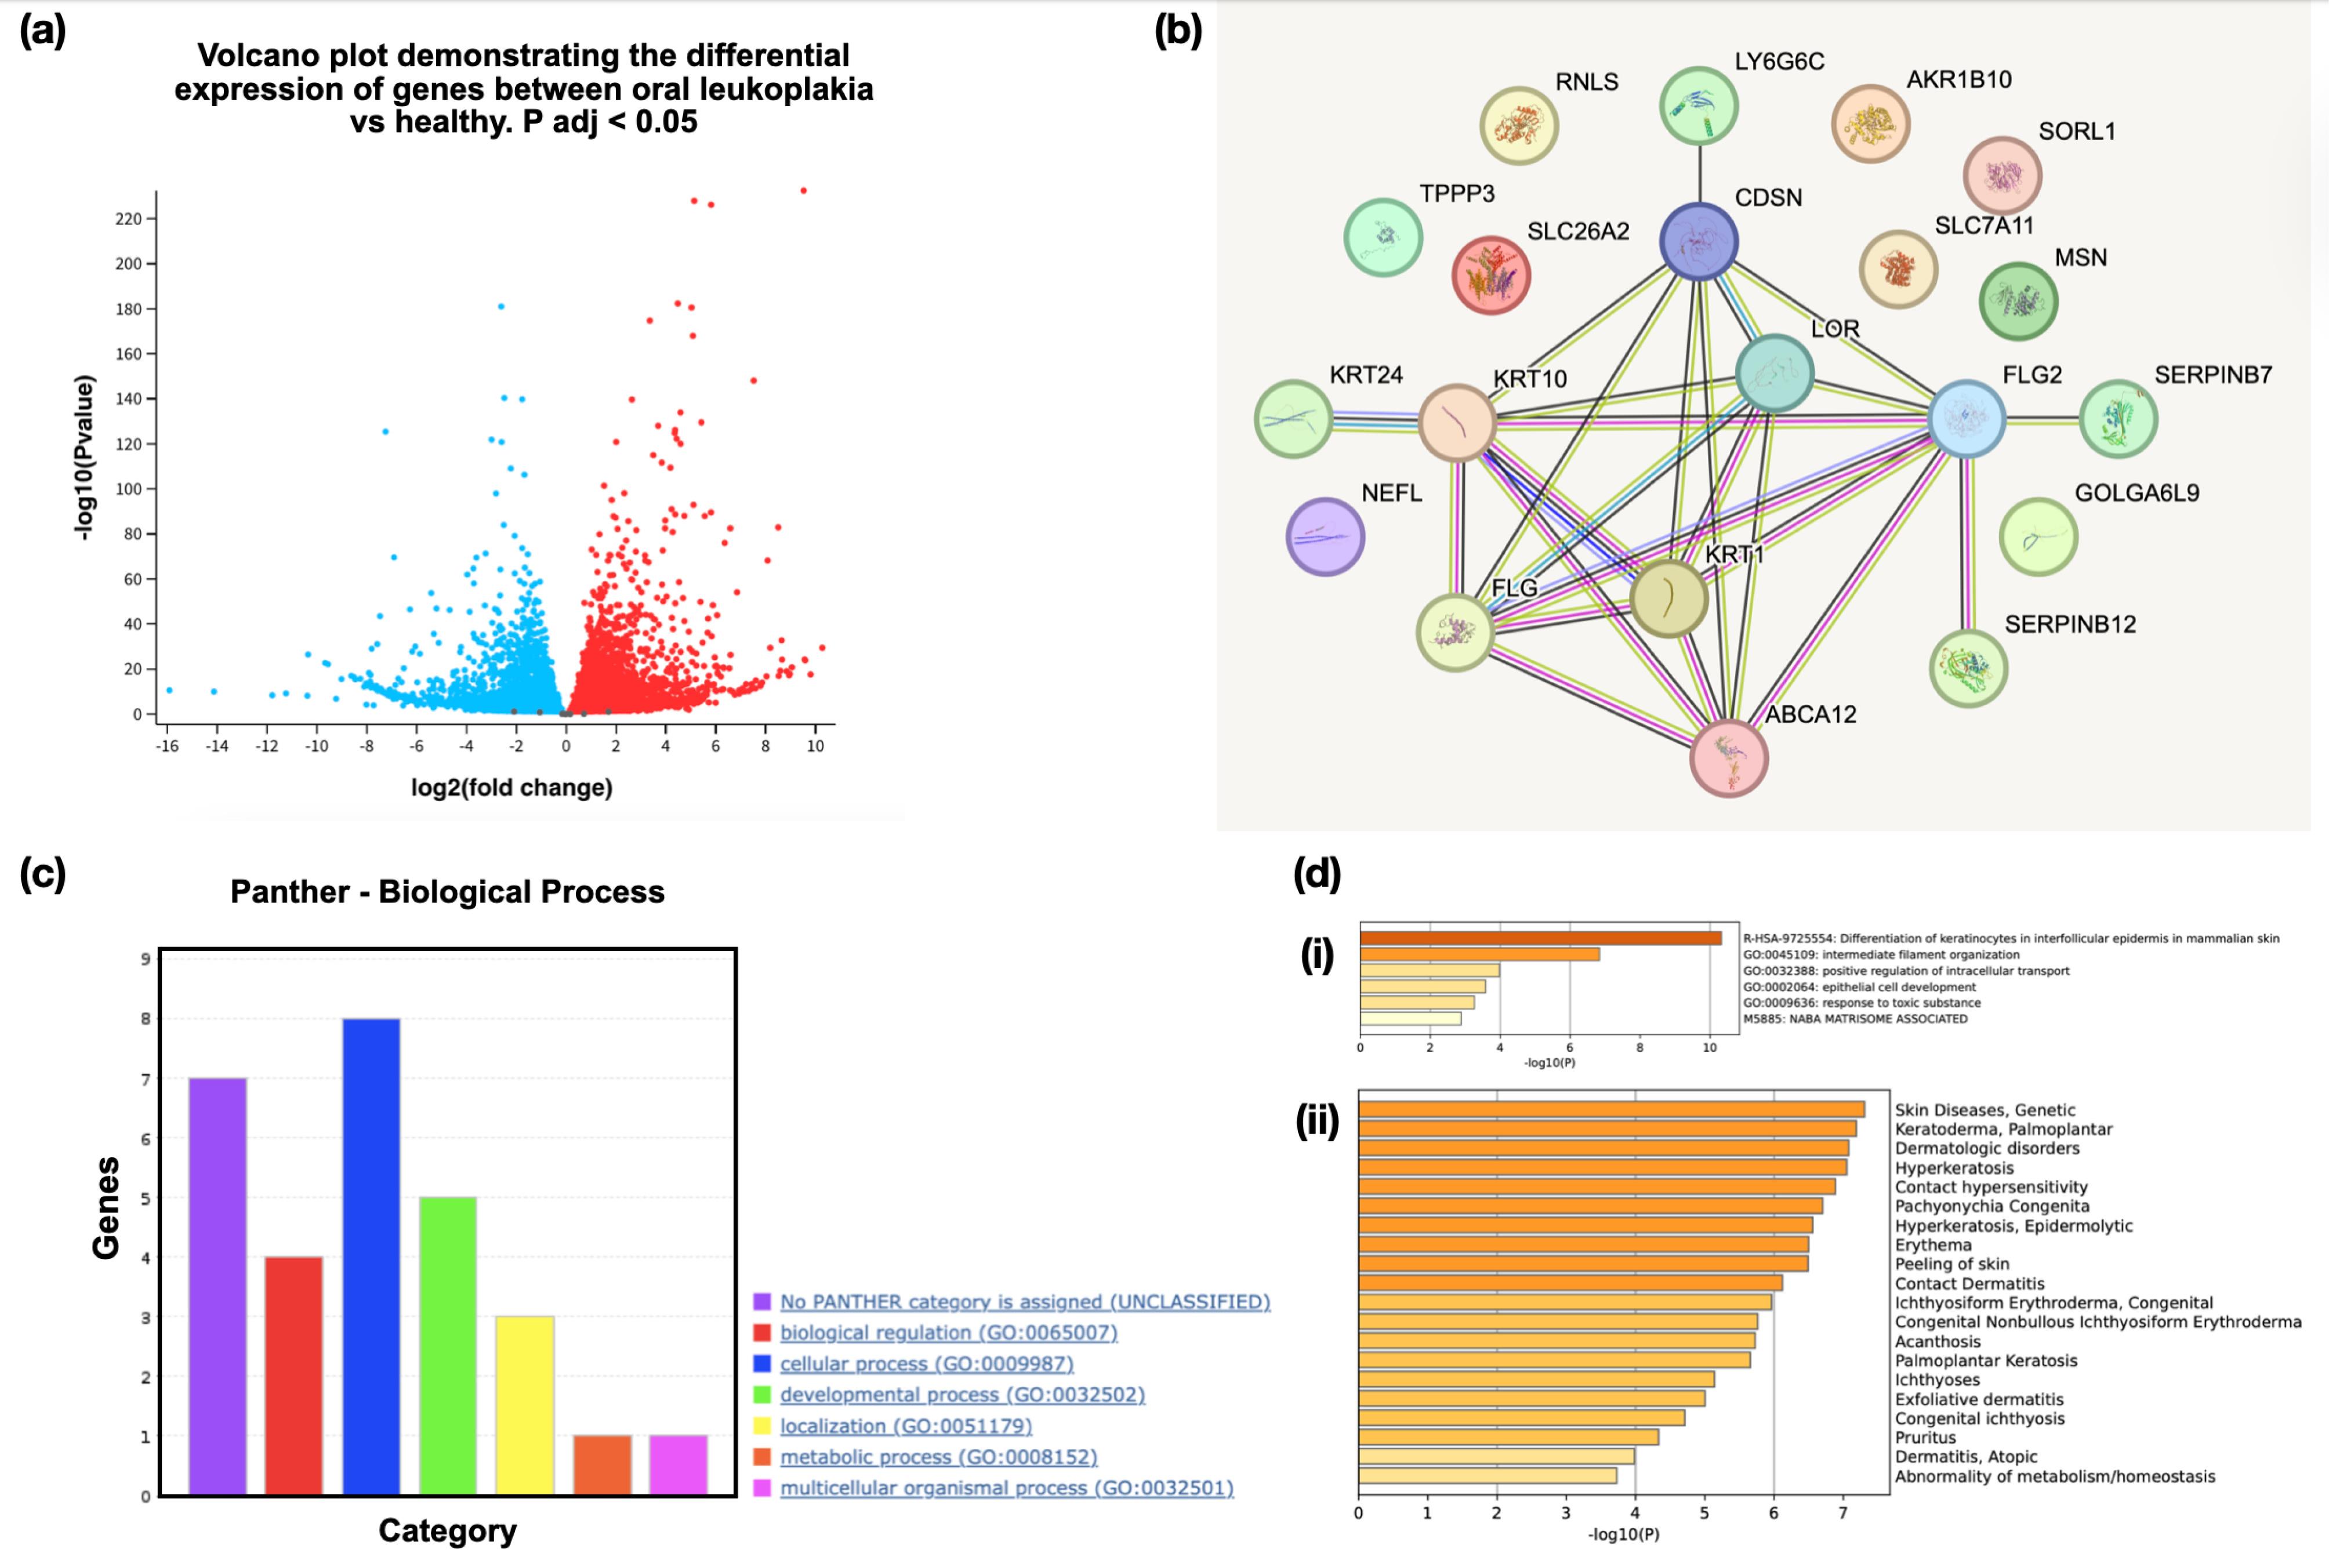
Figure 1.
(a) Volcano Plot Illustrating the Differential Gene Expression in the Oral Leukoplakia Tissues Compared to Healthy Oral Mucosal Tissues, (b) Protein-Protein Interaction Network of DEGs Identified in Oral Leukoplakia, (c) Gene Ontology Analysis of the Top 20 DEGs Demonstrating the Clustering of Genes Into Different Biological Processes, (d-i) Bar Graph Showing Genes Enriched Among the DEGs Across Different Pathways, (d-ii) Gene Enrichment Analysis Displaying Relatedness of Genes Among DEGs Related to Different Diseases. Note. DEG: Differentially expressed gene
.
(a) Volcano Plot Illustrating the Differential Gene Expression in the Oral Leukoplakia Tissues Compared to Healthy Oral Mucosal Tissues, (b) Protein-Protein Interaction Network of DEGs Identified in Oral Leukoplakia, (c) Gene Ontology Analysis of the Top 20 DEGs Demonstrating the Clustering of Genes Into Different Biological Processes, (d-i) Bar Graph Showing Genes Enriched Among the DEGs Across Different Pathways, (d-ii) Gene Enrichment Analysis Displaying Relatedness of Genes Among DEGs Related to Different Diseases. Note. DEG: Differentially expressed gene
Protein-Protein Interaction and Gene Enrichment Analysis
The PPI network demonstrated one cluster encompassing various genes, such as KRT24, KRT10, KRT1, FLG, FLG2, CDSN, LY6G6C, ABCA12, SERPINB12, and SERPINB7. There were 20 nodes and 25 edges, with a PPI enrichment P-value of < 1.0 x 10⁻¹⁶. The gene ontology analysis revealed multiple biological processes, such as positive regulation of protein localization to the early endosome, peptide crosslinking, keratinocyte differentiation, and the like (Figure 1b, Table 2).The PANTHER GO biological process categorizes 20 genes across various functional categories. Most genes are involved in cellular processes and biological regulation, followed by developmental processes, localization, and metabolic processes. A few genes remain unclassified. This distribution highlights these genes’ diverse biological roles, particularly in cellular and regulatory mechanisms (Figure 1c, Table 3). Figure 1d illustrates two bar charts analyzing biological processes and diseases related to skin conditions. Chart (i)highlights significant pathways, such as keratinocyte differentiation and intracellular transport, with varying levels of statistical significance (indicated by -log10(P)). Chart (ii) lists various skin diseases, including genetic disorders and conditions, such as hyperkeratosis and contact dermatitis, and it is also ranked by significance. The network suggests pathways related to keratinization, immune response, and cell adhesion, highlighting how these proteins may work together in biological processes relevant to skin and epithelial tissue integrity.
Table 2.
Gene Ontology Analysis Using STRING Revealing Key Pathways Related to Curated DEGs
|
Description
|
Count in Network
|
Strength
|
Signal
|
FDR
|
| Keratinocyte differentiation |
6 of 138 |
1.63 |
1.56 |
7.63E-05 |
| Skin development |
7 of 266 |
1.41 |
1.39 |
7.63E-05 |
| Establishment of skin barrier |
4 of 28 |
2.15 |
1.72 |
0.00011 |
| Epidermis development |
7 of 320 |
1.33 |
1.28 |
0.00011 |
| Peptide cross-linking |
4 of 37 |
2.03 |
1.61 |
0.00017 |
| Epithelial cell differentiation |
8 of 617 |
1.11 |
1.03 |
0.00017 |
| Epithelium development |
9 of 1069 |
0.92 |
0.77 |
0.00071 |
| Tissue development |
10 of 1723 |
0.76 |
0.58 |
0.0028 |
| Corneocyte desquamation |
2 of 2 |
2.99 |
0.99 |
0.0071 |
| Animal organ development |
12 of 3246 |
0.56 |
0.39 |
0.0144 |
| Regulation of body fluid levels |
5 of 371 |
1.12 |
0.56 |
0.0295 |
| Positive regulation of protein localization to early endosome |
2 of 8 |
2.39 |
0.65 |
0.0381 |
Note. DEG: Differentially expressed gene; FDR: False discovery rate.
Table 3.
DEGs Identified in Leukoplakia Classified Based on the Biological Process Assessed Using the PANTHER Gene Ontology Tool
|
Biological Process
|
Number of Genes
|
Genes
|
| Biological regulation |
4 |
SERPINB7, MSN, TPPP3, and SERPINB12 |
| Cellular process |
8 |
KRT10, KRT24, SORL1, LOR, SLC7A11, TPPP3, KRT1, and NEFL |
| Developmental process |
5 |
KRT10, KRT24, FLG2, KRT1,and FLG |
| Localization |
3 |
ABCA12, SORL1, and SLC7A11 |
| Metabolic process |
1 |
LOR
|
| Multicellular organismal process |
1 |
KRT1
|
Note. DEG: Differentially expressed gene.
Gene Expression Analysis
The expression of DEGs between oral leukoplakia and HNSCC tissues revealed nine upregulated and four downregulated genes and seven genes that showed no significant difference among the normal and primary tumor tissues. Some genes, such as SLC7A11, SERPINB7, CDSN, LY6G6C, ABCA12, NEFL, and MSN, were consistently upregulated in both conditions, suggesting their involvement in promoting cancerous transformation. Other genes, such as SLC26A2 and KRT24, were downregulated in both leukoplakia and HNSCC, potentially indicating a disrupted keratinization or cellular structure. Two others, such as SORL1 and GOLGA6L9, exhibited differential behavior, being downregulated in leukoplakia but upregulated in HNSCC, signifying a shift in their function as the disease advances to malignancy. Similarly, AKR1B10 and TPPP3 were upregulated in leukoplakia samples while downregulated in HNSCC tumors (Table 4). SLC7A11, CDSN, KRT24, and MSN demonstrated similar expression profiles in the leukoplakia (Figure 2a-d) and HNSCC (Figure 3a-d) datasets. The stage-wise expression profile also showed significant differences in expression among the early-stage HNSCC patients. The SLC7A11 gene represented significant upregulation in Stage 2 cases, whereas CDSN displayed a substantial increase in Stage 1 patients, with a decreasing trend in gene expression as the stage advanced. Although the expression of KRT24 across different stages was not significant, marked downregulation was observed between normal and primary tumor tissues. The MSN gene expression was significantly high in all the stages. Therefore, all these markers can be considered early HNSCC biomarkers (Figure 4a-d).
Table 4.
The Gene Expression Profile of DEGs Identified in Oral Leukoplakia Tissues in the HNSCC Dataset
|
Gene
|
Gene Expression in Leukoplakia
|
Gene Expression in HNSCC
|
P
Value
|
Kaplan Meier Survival Analysis (P Value)
|
Survival Outcome
|
|
FLG2
|
Upregulated |
Insignificant |
2.63 x 10-01 |
0.23 |
Insignificant |
|
SLC7A11
|
Upregulated |
Upregulated |
1.22 x 10⁻¹⁵ |
0.0088 |
Poor prognosis |
|
SERPINB7
|
Upregulated |
Upregulated |
4.07 x 10-03 |
0.13 |
Insignificant |
|
CDSN
|
Upregulated |
Upregulated |
4.33 x 10-02 |
0.036 |
Good prognosis |
|
LY6G6C
|
Upregulated |
Upregulated |
3.82 x 10-02 |
0.32 |
Insignificant |
|
SERPINB12
|
Upregulated |
Insignificant |
2.91 x 10-01 |
0.001 |
Insignificant |
|
FLG
|
Upregulated |
Insignificant |
1.95 x 10-01 |
0.12 |
Insignificant |
|
SLC26A2
|
Downregulated |
Downregulated |
4.8 x 10-03 |
0.056 |
Insignificant |
|
SORL1
|
Downregulated |
Upregulated |
2.46 x 10⁻¹² |
0.012 |
Poor prognosis |
|
ABCA12
|
Upregulated |
Upregulated |
1.38 x 10-03 |
0.22 |
Insignificant |
|
KRT1
|
Upregulated |
Insignificant |
9.79 x 10-01 |
0.15 |
Insignificant |
|
LORICRIN/LOR
|
Upregulated |
Insignificant |
2.56 x 10-01 |
0.0051 |
Good prognosis |
|
AKR1B10
|
Upregulated |
Downregulated |
1.19 x 10-06 |
0.26 |
Insignificant |
|
TPPP3
|
Upregulated |
Downregulated |
1.63 x 10-02 |
0.0016 |
Poor prognosis |
|
KRT24
|
Downregulated |
Downregulated |
7.36 x 10-03 |
0.036 |
Poor prognosis |
|
NEFL
|
Upregulated |
Upregulated |
< 10-12 |
0.067 |
Insignificant |
|
KRT10
|
Upregulated |
Insignificant |
8.57 x 10-01 |
0.26 |
Insignificant |
|
GOLGA6L9
|
Downregulated |
Upregulated |
4.55 x 10-02 |
0.0091 |
Poor prognosis |
|
MSN
|
Upregulated |
Upregulated |
1.62 x 10⁻¹² |
0.035 |
Poor prognosis |
|
RNLS
|
Downregulated |
Insignificant |
1.74 x 10-01 |
0.19 |
Insignificant |
Note. DEG: Differentially expressed gene.
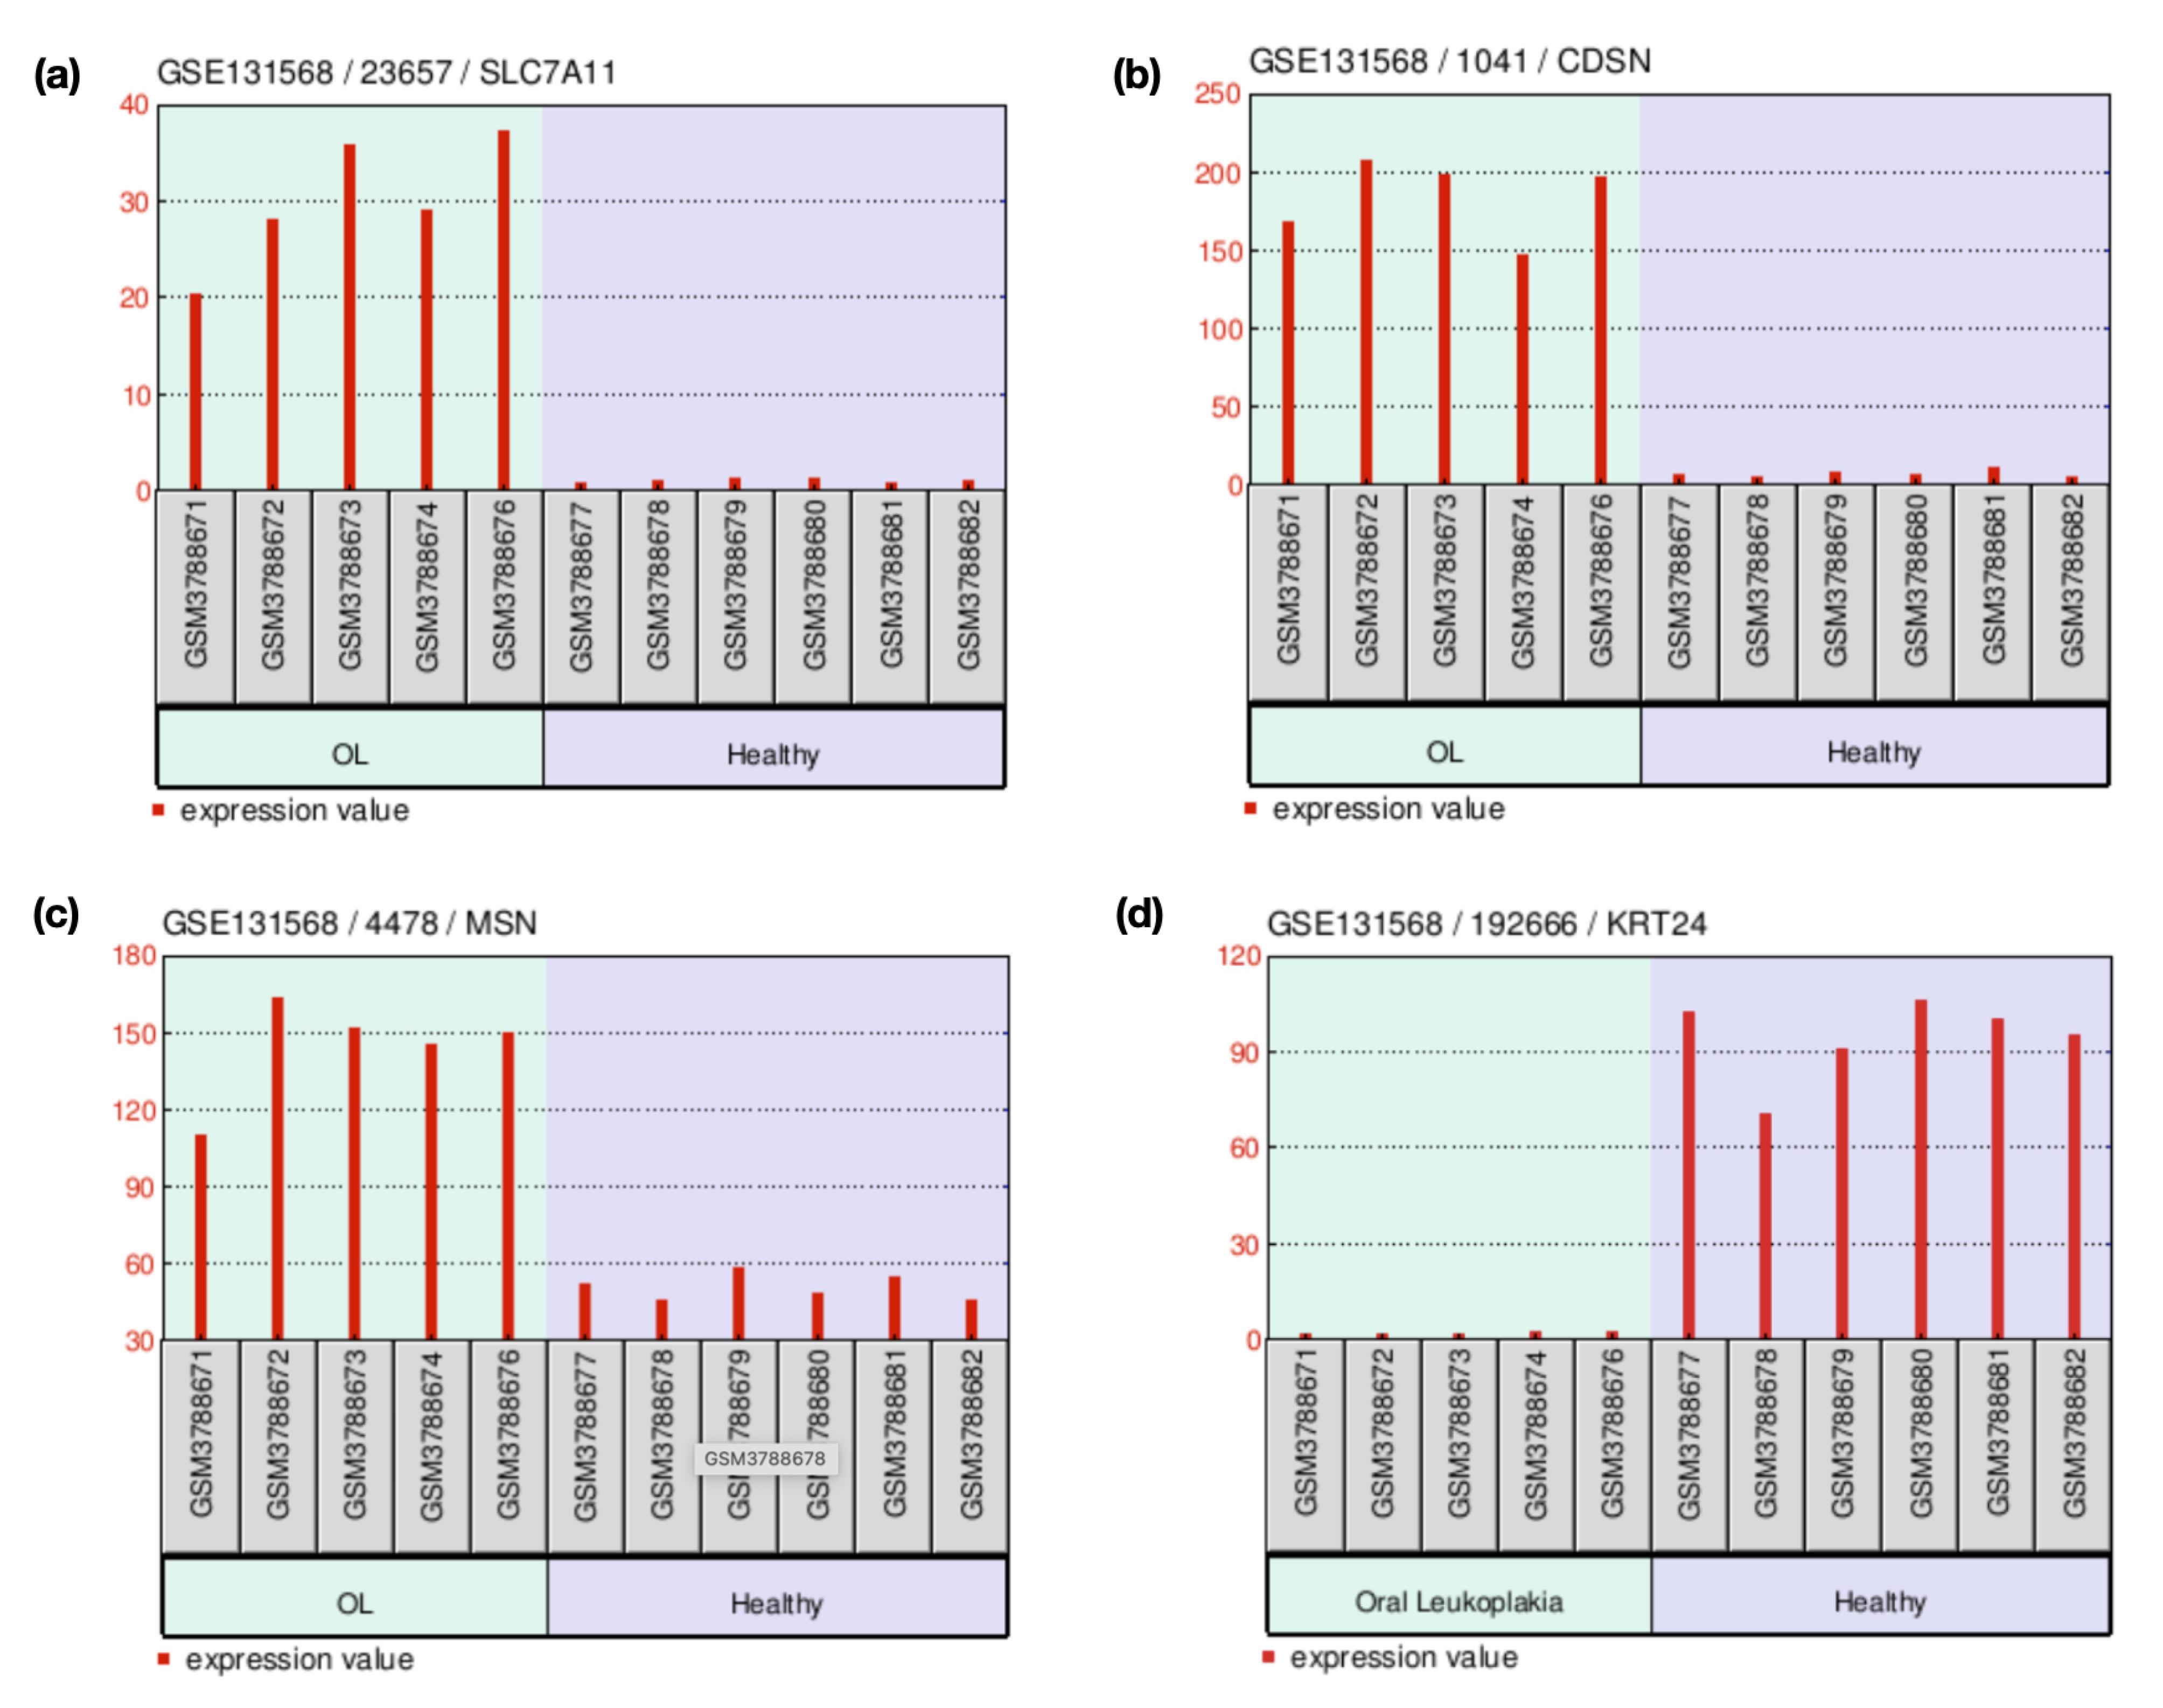
Figure 2.
The Bar Graph Depicting the Expression of the Upregulated Genes (a)SLC7A11 (1.28 x 10-228), (b)CDSN (2.96 x 10-181), and (c)MSN (1.49 x 10-121), and the Downregulated Gene (d)KRT24 (3.82 x 10-126) in Oral Leukoplakia and Normal Healthy Oral Mucosal Tissues. Note. A P-value less than 0.05 was considered statistically significant
.
The Bar Graph Depicting the Expression of the Upregulated Genes (a)SLC7A11 (1.28 x 10-228), (b)CDSN (2.96 x 10-181), and (c)MSN (1.49 x 10-121), and the Downregulated Gene (d)KRT24 (3.82 x 10-126) in Oral Leukoplakia and Normal Healthy Oral Mucosal Tissues. Note. A P-value less than 0.05 was considered statistically significant
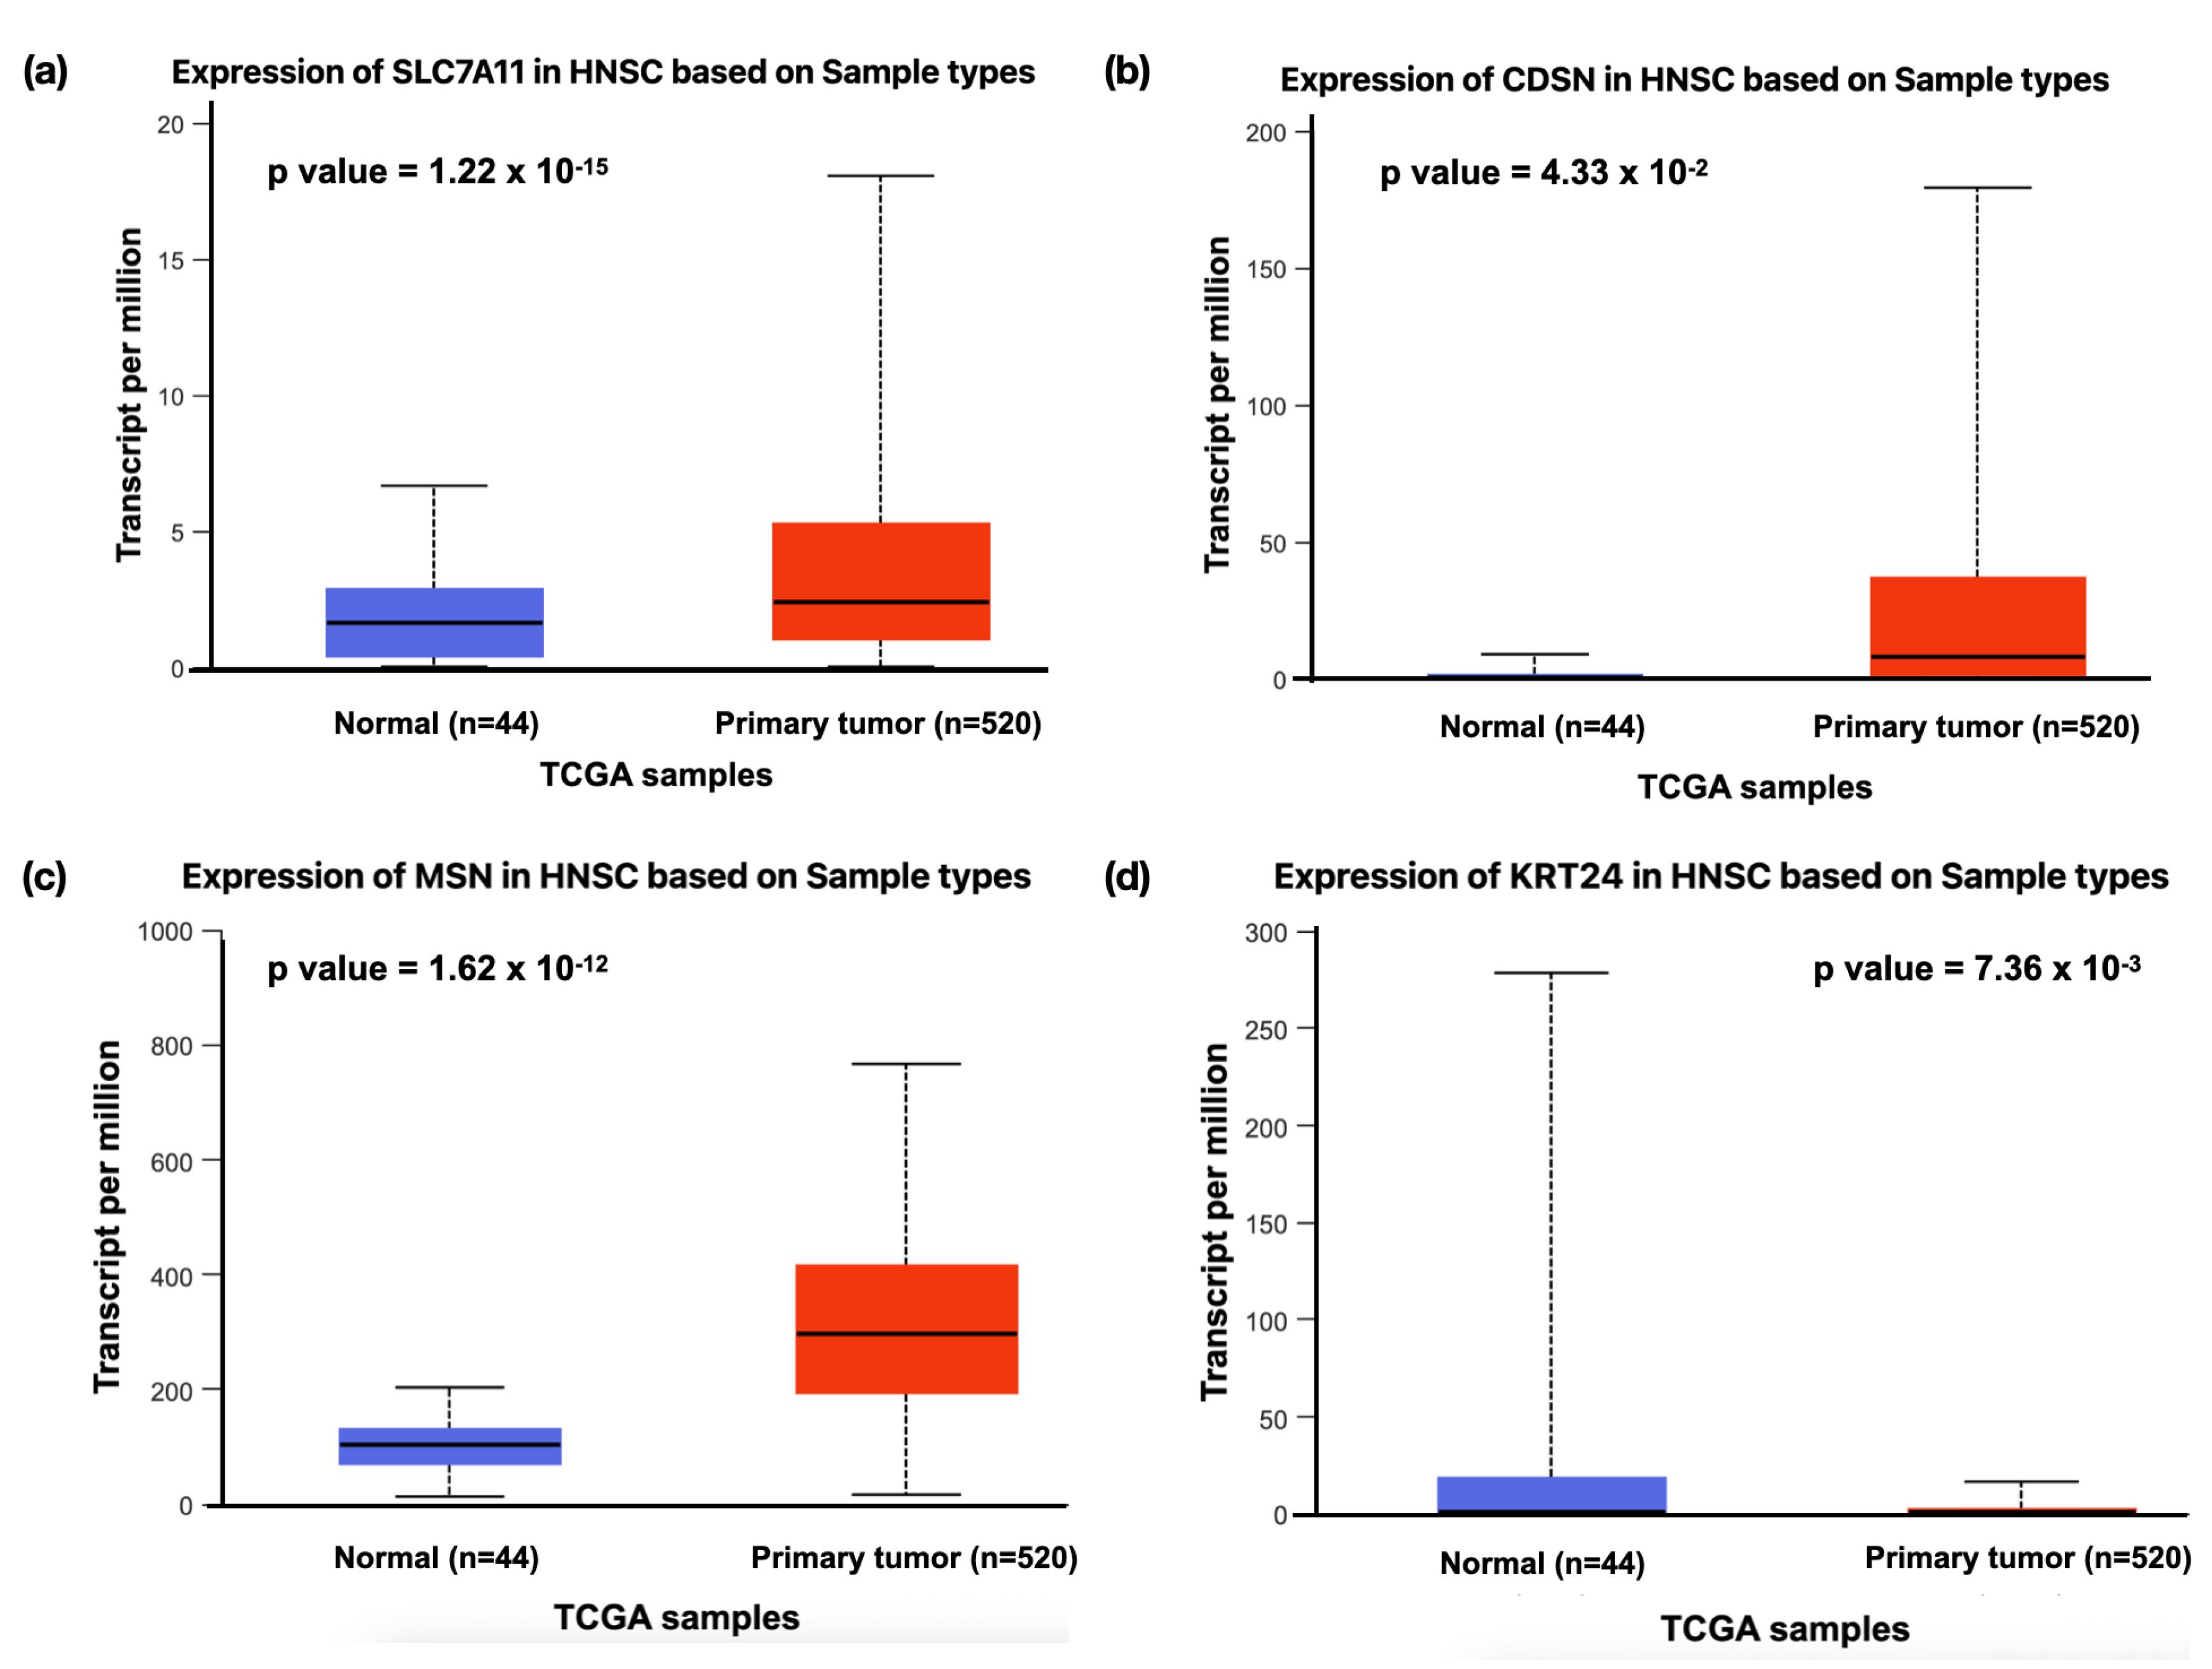
Figure 3.
The Box Whisker Plot Displaying the Expression of the Upregulated Genes (a)SLC7A11 (1.22 x 10⁻¹⁵), (b)CDSN (4.33 x 10-02), and (c)MSN (1.62 x 10⁻¹²), and the Downregulated Gene (d)KRT24 (7.36 x 10-03) in Head and Neck Squamous Cell Carcinoma (HNSCC) Patients. Note. A P-value less than 0.05 was considered statistically significant
.
The Box Whisker Plot Displaying the Expression of the Upregulated Genes (a)SLC7A11 (1.22 x 10⁻¹⁵), (b)CDSN (4.33 x 10-02), and (c)MSN (1.62 x 10⁻¹²), and the Downregulated Gene (d)KRT24 (7.36 x 10-03) in Head and Neck Squamous Cell Carcinoma (HNSCC) Patients. Note. A P-value less than 0.05 was considered statistically significant
Survival Analysis
Kaplan-Meier survival analysis linked SLC7A11 (P = 0.0088) and MSN (P = 0.035) to poor survival outcomes, emphasizing their role in cancer metabolism and oxidative stress resistance. The median survival months for the SLC7A11 low-expression and high-expression groups were 65.73 and 32.93, respectively. Similarly, for the MSN low-expression and high-expression groups, it was 58.73 and 33.27. On the other hand, the downregulation of KRT24 (P = 0.036) resulted in a poor prognosis. The median survival months for KRT24 were 58.27 and 37.77 for the high-expression and low-expression groups, respectively. Interestingly, CDSN (P = 0.036), though upregulated, was found to improve the survival of HNSCC patients (Figure 4). The median survival month was 66.73 for the CDSN high-expression group and 42.97 for the low-expression group. This gene was observed to present with the most extended survival period among the three upregulated genes, with a positive outcome on the patient’s survival(Figure 5a-d). Based on the survival analysis, the upregulation of SLC7A11 and MSN led to poor prognosis in HNSCC patients due to oncogenic functions, while the increased expression of CDSN resulted in a good prognosis. On the other hand, the downregulation of KRT24 caused poor prognosis, indicating its tumor-suppressive role in HNSCC patients.
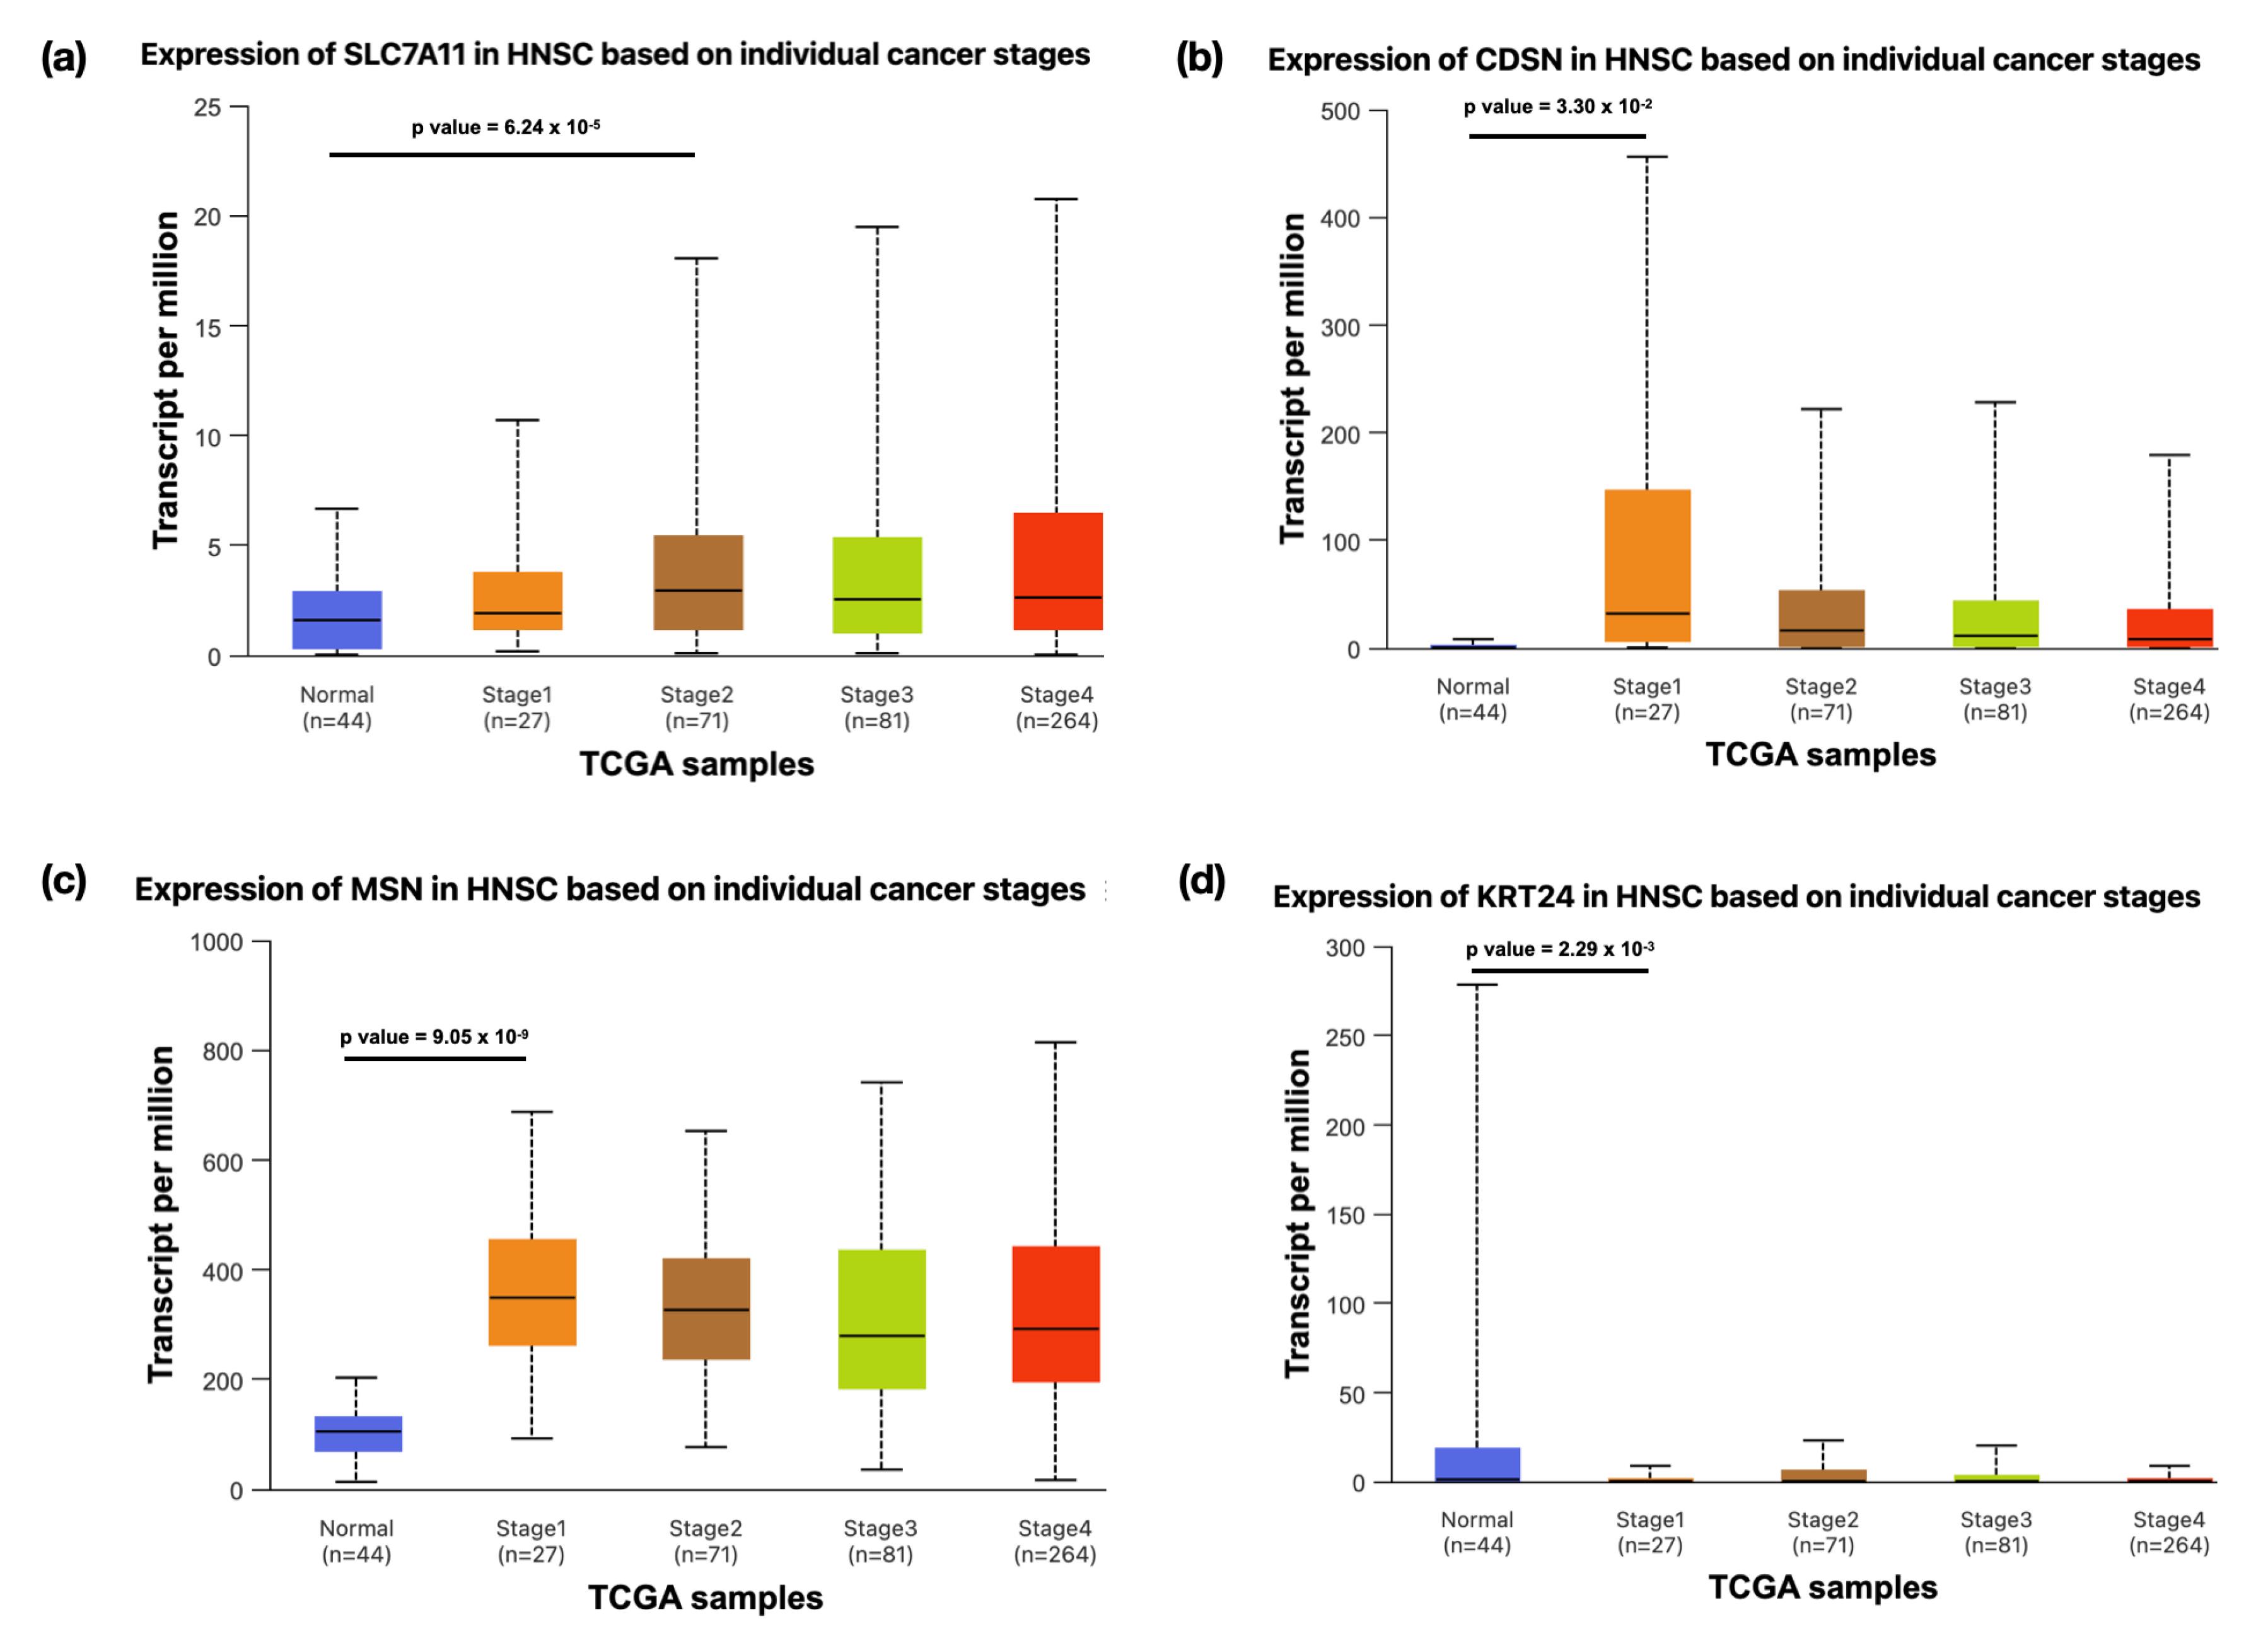
Figure 4.
The Box-Whisker Plot Demonstrating the Expression of (a) SLC7A11, (b) CDSN, (c) MSN, and(d) KRT24 Across Different Stages of Primary Tumor Samples Derived From HNSCC Patients Compared to Normal Samples. Note. A P value less than 0.05 is considered to be statistically significant
.
The Box-Whisker Plot Demonstrating the Expression of (a) SLC7A11, (b) CDSN, (c) MSN, and(d) KRT24 Across Different Stages of Primary Tumor Samples Derived From HNSCC Patients Compared to Normal Samples. Note. A P value less than 0.05 is considered to be statistically significant
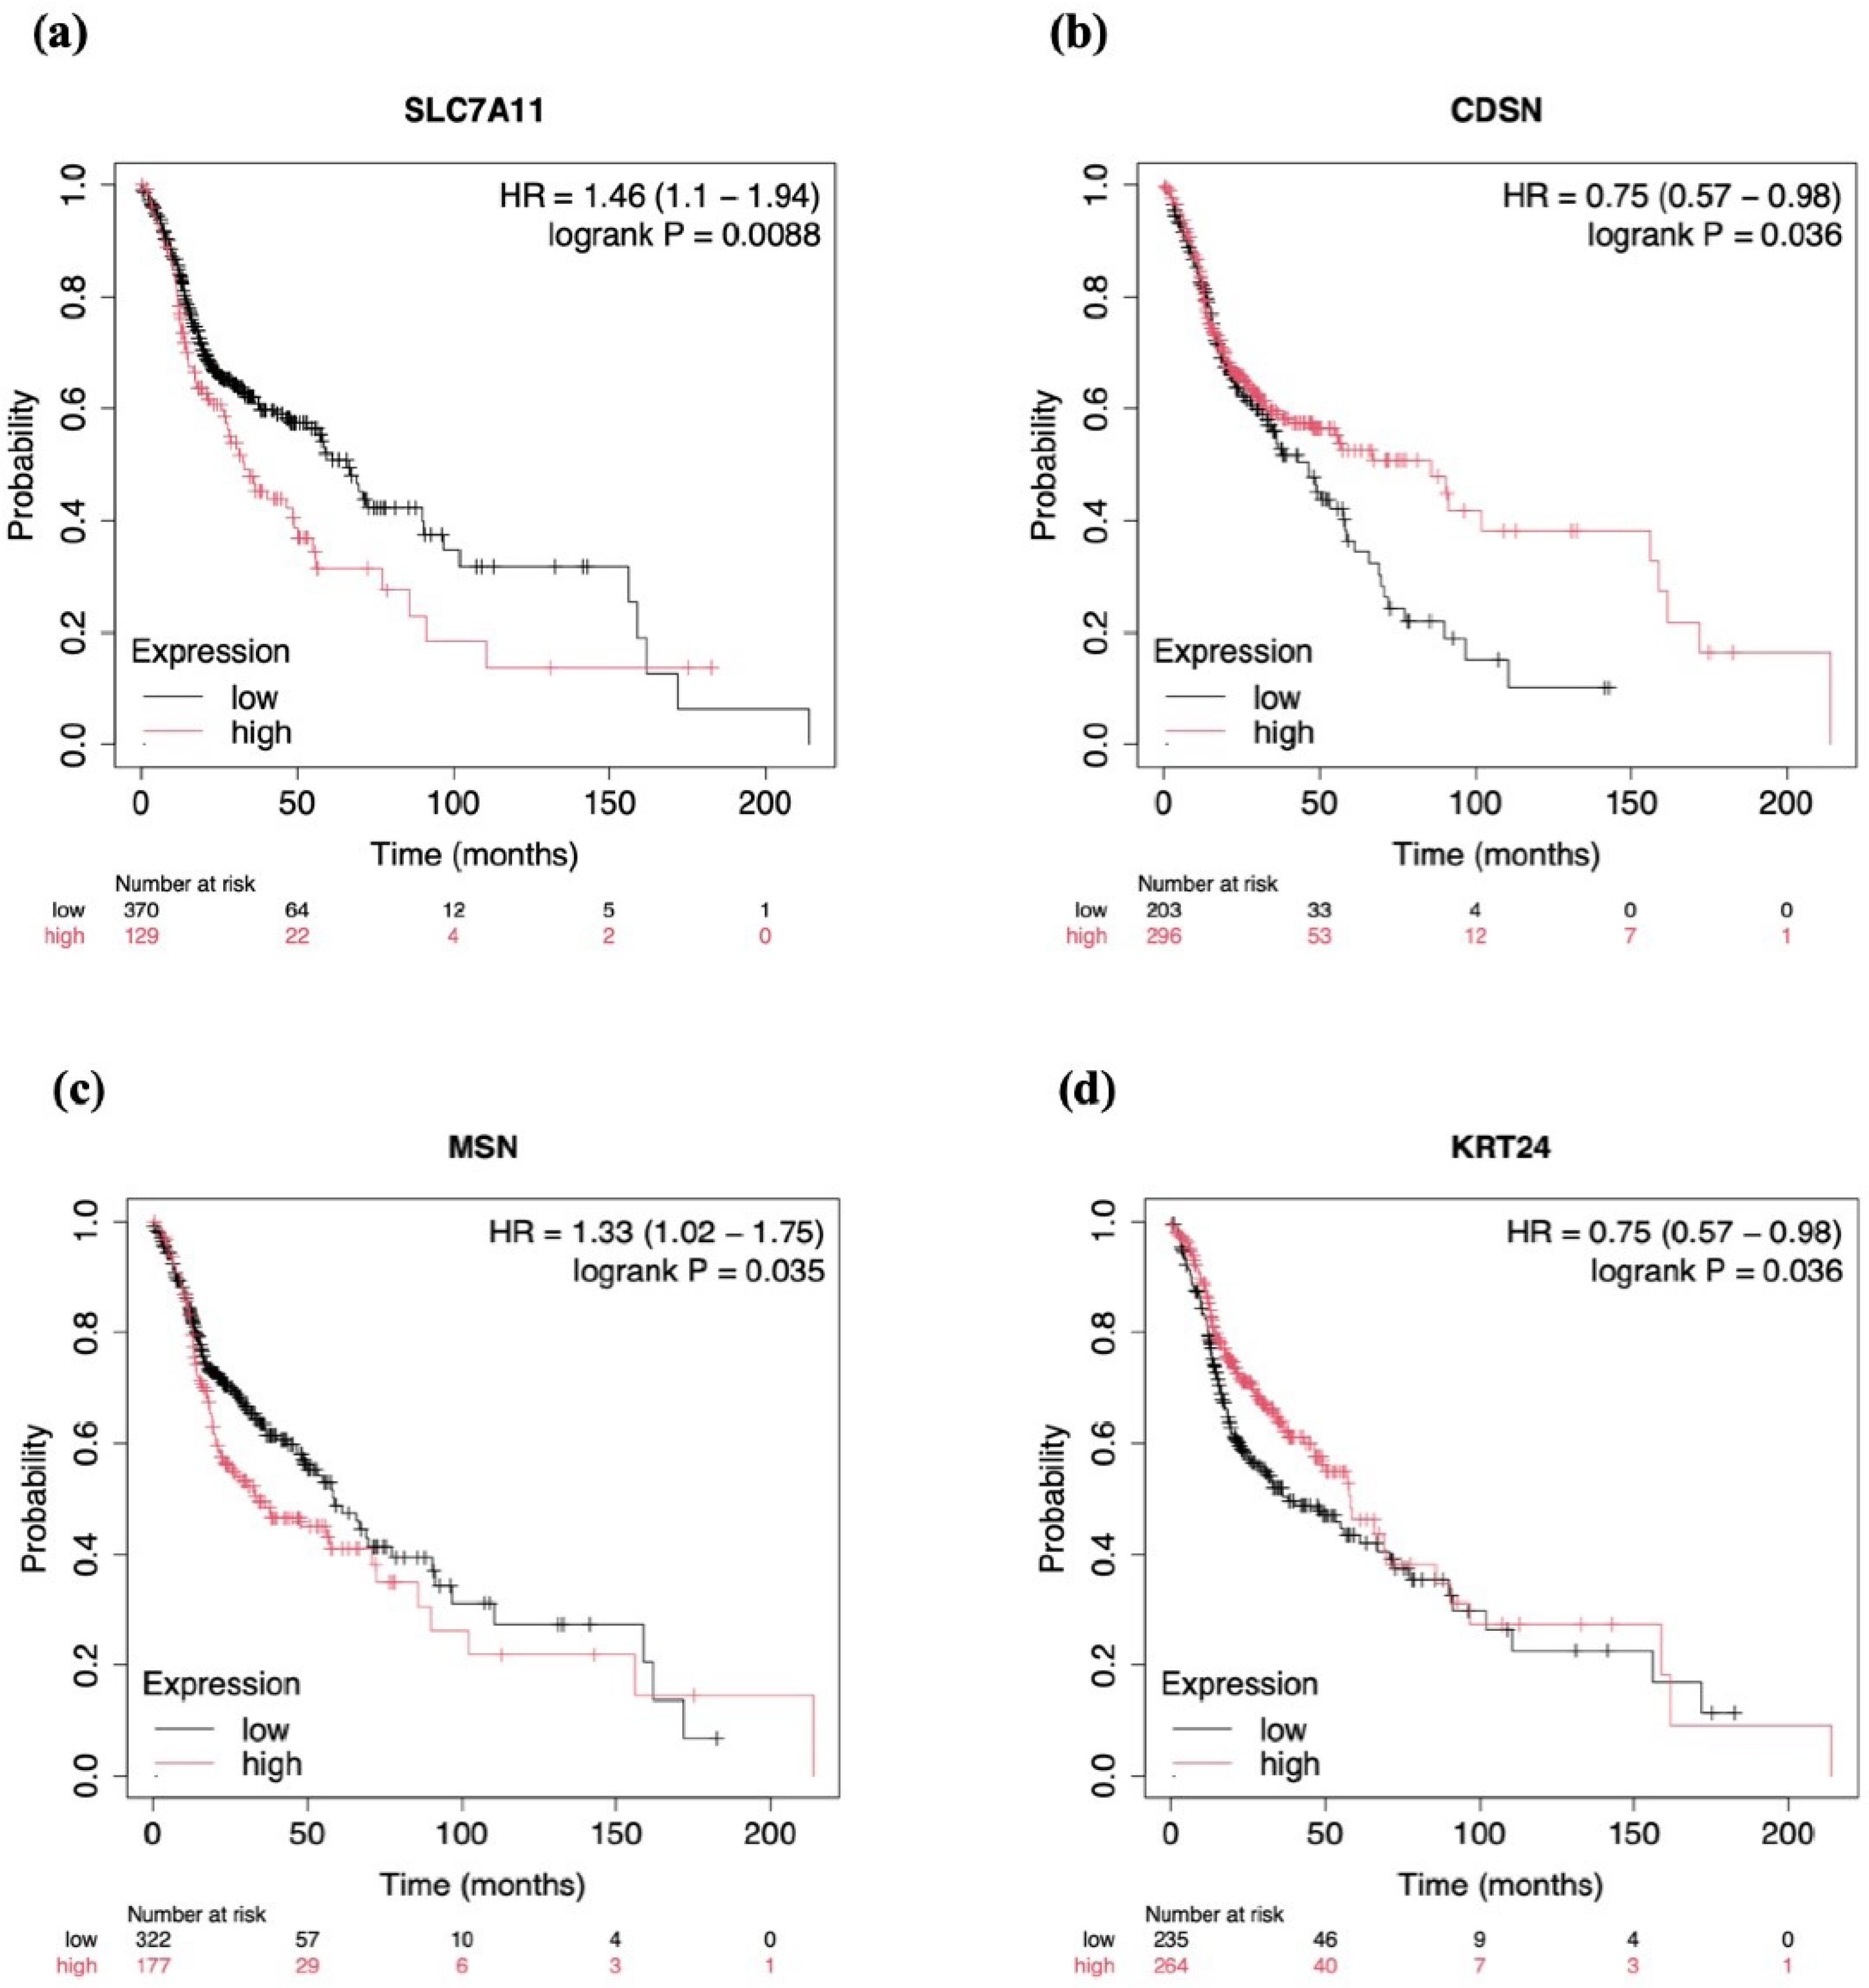
Figure 5.
Kaplan-Meier Survival Analysis of the Upregulated Genes (a) SLC7A11, (b) CDSN, and(c) MSN, and the Downregulated Gene (d) KRT24 in Head and Neck Squamous Cell Carcinoma Patients. Note. a. P = 0.0088, b. (P = 0.036), c. (P = 0.035), and d. (P = 0.036). A P-value less than 0.05 was considered statistically significant
.
Kaplan-Meier Survival Analysis of the Upregulated Genes (a) SLC7A11, (b) CDSN, and(c) MSN, and the Downregulated Gene (d) KRT24 in Head and Neck Squamous Cell Carcinoma Patients. Note. a. P = 0.0088, b. (P = 0.036), c. (P = 0.035), and d. (P = 0.036). A P-value less than 0.05 was considered statistically significant
Discussion
Computational approaches employing large language models utilize machine learning algorithms, especially deep learning,to analyze several datasetsand interpret the results based on the scores (23,24). The present study attempted to reveal the genes and gene clusters that could influence the phenotype of oral leukoplakia, thereby contributing to the initiation and progression of oral cancer by employing computational strategies. Among the top 20 genes curated, three were overexpressed, and one was underexpressed in both datasets. All four genes strongly correlated with the prognosis of HNSCC patients by improving or affecting their survival.
The first gene, SLC7A11, encodes the protein solute carrier family 7 member 11, which is involved in amino acid transport, glutathione synthesis, and oxidative process. Accumulating evidence supports that the increased expression of SLC7A11 was connected to a decreased survival rate in cancer patients. Although this gene’s expression is considered beneficial in some cases and deleterious in other cancer types, a careful assessment of its functional role is essential to dissect the diverse actions of this gene in different cancer types (25). A study examining the role of the amino acid transporter SLC7A11 in breast cancer (BC) revealed that it helps cancer cells survive by facilitating cystine uptake in exchange for glutamate, thus supporting antioxidant defenses. The analysis of large BC datasets also confirmed that the higher expression of SLC7A11 was associated with more advanced tumor grade and specific BC subtypes, such as triple-negative BC and human epidermal growth factor receptor 2-positive. Additionally, increased SLC7A11 expression was linked to poorer patient outcomes and more significant infiltration of immune cells (26). The translational value of SLC7A11 was demonstrated in lung adenocarcinoma. It was found that it regulates tumor immunity by modifying the immune checkpoint expression (27). A team of researchers discovered that the upregulation of SLC7A11 effectively shielded cancer cells from the damaging effects of oxidative stress. Antioxidant mechanisms are considered to be a “double-edged sword”. The pathways can be both protective and potentially harmful (28). The accumulation of intracellular cysteine, depletion of nicotinamide adenine dinucleotide phosphate, and collapse of the redox system were attributed to stress-induced death in SLC7A11 overexpressing cancer cells (29). Therefore, the results obtained from the present study with respect to the gene expression profile of SLC7A11 are in agreement with reports pertaining to other cancer types.
The second gene, CDSN, encodingcorneodesmosin, is a glycoprotein expressed in the epidermal layers and hair follicles. It contributes to the cohesion of keratinocytes. Early proteolysis of corneodesmosin is associated with the fragility of desmosomes, while persistent expression leads to hyperkeratosis, a common presentation in OPMDs (30). Di et al explored the relationship between CDSN and OSCC using computational methods, clinical data analysis, and statistical modeling. Their research identified CDSN as a key gene affecting OSCC prognosis. The lower expression of CDSN was related to poor prognosis and shorter survival in OSCC patients, highlighting its substantial predictive value for survival outcomes (31). Another study identified DNA methylation as the main mechanism that drives the expression of the CDSN gene (32). The hypomethylation of the CDSN gene resulted in overexpression, which in turn contributed to tumor progression in HNSCC patients. Although a limited number of studies have reported the association between the CDSN gene and other cancer types, the present study provided concordant evidence on the expression of CDSN in leukoplakia and HNSCC cases that correlated well with the improved survival of HNSCC patients.
The third gene, KRT24, encodes cytokeratin 24, a tumor suppressor protein essential in managing HNSCC. Keratin is the main cytoskeletal protein whose expression contributes to the evolutionary adaptation of epithelium to varying environments. K24 or KRT24 also serves as a differentiation marker for epidermal keratinocytes (33). Several literature sources have discussed the dysplastic changes in oral keratinocytes, pointing toward their indispensable role in cancer progression (34). A study by Gül et al embarked toward identifying novel biomarkers for HNSCC by analyzing transcriptomic profiles from primary tumors, metastases, and non-malignant tissue of 20 patients and a TCGA HNSCC cohort of 554 patients. The key signaling networks and cytokeratin 24 were identified as potential biomarkers. Thedownregulation of cytokeratin 24 correlated with poor survival, and upregulation reduced tumor growth in cell lines and murine models, suggesting its role as a tumor suppressor and potential therapeutic target in HNSCC (35). Earlier researchers investigated DEGs and their possible role in the early onset of colorectal cancer by employing microarrays. Nearly seven genes showed marked upregulation in the mucosa of six patients with hereditary nonpolyposis colorectal cancer and inherited familial adenomatous polyposis. This observation suggested that the mucosa of patients is primed during early tumorigenesis and that identifying these markers could aid in developing early diagnostic markers based on the expression of these genes. The findings of the present study also confirmed this presentation, emphasizing the role of KRT24 as a potent tumor suppressor gene upregulated during the early tumorigenesis process, making it an ideal candidate gene for early cancer diagnosis (36).
The fourth gene,MSN, encoding moesin, belongs to the family of ezrin-radixin-moesin. It is involved in cell migration by mediating the crosslinking between the actin cytoskeleton, membrane, and receptors. Accumulating evidence states that the dysregulation of cell signaling and cytoskeleton maintenance due to defects in ezrin-radixin-moesin protein can be associated with cancer progression (37). Yu et al demonstrated the role of MSN in BC prognosis. Immunohistochemistry assessed moesin expression in 404 BC patients and 46 fibroadenoma cases. Moesin was overexpressed in BC (47.8%) compared to fibroadenoma (15.2%). The overexpression of moesin has been strongly linked to advanced clinical stage, lymph node metastasis, and reduced recurrence-free survival in BC patients, especially in those who are estrogen receptor-positive and undergoing tamoxifen treatment. These findings emphasize the critical role of moesin as a potential prognostic marker for BC progression and the poor outcomes associated with it. This underscores the need for further research on moesin and its significant impact on clinical decision-making and patient outcomes (38). The present study identified a few infamous genes associated with a spectrum of oral diseases. Despite the availability of exhaustive data from various sources (39,40), more investigations on novel pathways and genes related to a specific population are warranted to derive disease-gene associations.
Having addressed all the merits of the study, this study also suffers a few potential limitations. Different study groups were involved in deriving the hub of genes related to each of the datasets, and the habitual status of the individuals varied across the datasets, which has to be taken into consideration. Although several other components can regulate the expression profiles (e.g., epigenetic factors and epi-transcriptomic modifiers), the study focused principally on the genetic factors. It will be worthwhile to investigate the cumulative effect of all the factors that can potentially influence the expression pattern of a gene. Finally, the computational approaches with all the strengths addressed have to be validated in a real-time environment or a biological system to provide concrete evidence of the association with OPMDs and oral cancer.
Conclusion
In conclusion, this study underscores the pivotal role of four key genes, namely, SLC7A11, CDSN, KRT24, and MSN, in driving the progression of oral leukoplakia and their potential impact on the prognosis of HNSCC. The gene expression patterns strongly indicate that these genes influence crucial cellular processes related to oxidative stress, cellular adhesion, and keratinization. Therefore, future studies should validate these biomarkers in larger independent cohorts and explore their mechanistic roles by conducting functional studies. Additionally, integrating genetic, epigenetic, and environmental factors could enhance our understanding of their regulation. Investigating these pathways in clinical settings could lead to developing personalized medicine approaches to improve patient outcomes. Extending the application of these findings in non-invasive diagnostic tools, such as saliva or buccal swabs, holds great promise for the early detection and monitoring of the progression of potentially malignant conditions to malignancy. Continued research across the globe using computational approaches will transform the field of precision medicine, ultimately reducing the burden of HNSCC.
Acknowledgements
The authors thank the cohorts, patients and researchers who made the data avaialble for investigations. The authors are also greatful for all the developers of tools that were used in this investigation.
Competing Interests
The authors declared no potential conflict of interests.
Ethical Approval
Not applicable.
Funding
None.
References
- Nikam SS, Gota V, Gupta PC, Puntambekar N, Singh A, Chaturvedi P. Variability in addictive and carcinogenic potential of smokeless tobacco products marketed in Mumbai, India: a surveillance study. Lancet Reg Health Southeast Asia 2024; 29:100457. doi: 10.1016/j.lansea.2024.100457 [Crossref] [ Google Scholar]
- Coletta RD, Yeudall WA, Salo T. Current trends on prevalence, risk factors and prevention of oral cancer. Front Oral Health 2024; 5:1505833. doi: 10.3389/froh.2024.1505833 [Crossref] [ Google Scholar]
- Warnakulasuriya S. Oral potentially malignant disorders: a comprehensive review on clinical aspects and management. Oral Oncol 2020; 102:104550. doi: 10.1016/j.oraloncology.2019.104550 [Crossref] [ Google Scholar]
- Kumari P, Debta P, Dixit A. Oral potentially malignant disorders: etiology, pathogenesis, and transformation into oral cancer. Front Pharmacol 2022; 13:825266. doi: 10.3389/fphar.2022.825266 [Crossref] [ Google Scholar]
- Kizhakkoottu S, Ramani P, Tilakaratne WM. Role of stem cells in the pathogenesis and malignant transformation of oral submucous fibrosis. Stem Cell Rev Rep 2024; 20(6):1512-20. doi: 10.1007/s12015-024-10744-0 [Crossref] [ Google Scholar]
- Porto UN, Laureano NK, Santos NS, Rodrigues AZ, Ferri CA, Lima TB. Leukoplakia and erythroplakia in youngers versus older individuals: a clinicopathological retrospective study. Med Oral Patol Oral Cir Bucal 2024; 29(5):e665-72. doi: 10.4317/medoral.26659 [Crossref] [ Google Scholar]
- Kaunein N, Ramani RS, Koo K, Moore C, Celentano A, McCullough M. A systematic review of microRNA signatures associated with the progression of leukoplakia with and without epithelial dysplasia. Biomolecules 2021; 11(12):1879. doi: 10.3390/biom11121879 [Crossref] [ Google Scholar]
- Senevirathna K, Mahakapuge TA, Jayawardana NU, Rajapakse J, Gamage CU, Seneviratne B. Serum mRNA levels of cytokeratin-19 and vascular endothelial growth factor in oral squamous cell carcinoma and oral potentially malignant disorders using RT-PCR. BMC Oral Health 2024; 24(1):1062. doi: 10.1186/s12903-024-04834-1 [Crossref] [ Google Scholar]
- Aparna J, Aseervatham Selvi SG, Arumugam P, Jayaseelan VP. Deciphering the genetic alterations in matrix metallo-proteinase gene family and its putative association with head and neck squamous cell carcinoma. Mol Biol Res Commun 2021; 10(1):13-22. doi: 10.22099/mbrc.2020.38344.1544 [Crossref] [ Google Scholar]
- Sharma V, Pandi A, Aseervatham Selvi SG, Arumugam P, Jayaseelan VP. An investigation on the genetic alterations of the ALG3 gene and their possible correlation with the development of HNSCC and LUSC. Eurasian J Med Oncol 2024; 8(1):81-7. doi: 10.14744/ejmo.2024.23872 [Crossref] [ Google Scholar]
- Gopalakrishnan S, Pandi A, Arumugam P, Jayaseelan VP. MicroRNAs targeting CDKN2A gene as a potential prognostic marker in head and neck squamous cell carcinoma. Mol Biol Res Commun 2024; 13(1):21-7. doi: 10.22099/mbrc.2023.48081.1853 [Crossref] [ Google Scholar]
- Muthumanickam P, Ramasubramanian A, Pandi C, Kannan B, Pandi A, Ramani P. The novel m6A writer methyltransferase 5 is a promising prognostic biomarker and associated with immune cell infiltration in oral squamous cell carcinoma. J Oral Pathol Med 2024; 53(8):521-9. doi: 10.1111/jop.13568 [Crossref] [ Google Scholar]
- Xu S, Song Y, Shao Y, Zhou H. Comprehensive analysis of circular RNA in oral leukoplakia: upregulated circHLA-C as a potential biomarker for diagnosis and prognosis. Ann Transl Med 2020; 8(21):1375. doi: 10.21037/atm-20-3840 [Crossref] [ Google Scholar]
- Xu S, Song Y, Shao Y, Zhou H. Hsa_circ_0060927 is a novel tumor biomarker by sponging miR-195-5p in the malignant transformation of OLK to OSCC. Front Oncol 2021; 11:747086. doi: 10.3389/fonc.2021.747086 [Crossref] [ Google Scholar]
- Szklarczyk D, Gable AL, Lyon D, Junge A, Wyder S, Huerta-Cepas J. STRING v11: protein-protein association networks with increased coverage, supporting functional discovery in genome-wide experimental datasets. Nucleic Acids Res 2019; 47(D1):D607-13. doi: 10.1093/nar/gky1131 [Crossref] [ Google Scholar]
- Mi H, Thomas P. PANTHER pathway: an ontology-based pathway database coupled with data analysis tools. Methods Mol Biol 2009; 563:123-40. doi: 10.1007/978-1-60761-175-2_7 [Crossref] [ Google Scholar]
- Mi H, Ebert D, Muruganujan A, Mills C, Albou LP, Mushayamaha T. PANTHER version 16: a revised family classification, tree-based classification tool, enhancer regions and extensive API. Nucleic Acids Res 2021; 49(D1):D394-403. doi: 10.1093/nar/gkaa1106 [Crossref] [ Google Scholar]
- Zhou Y, Zhou B, Pache L, Chang M, Khodabakhshi AH, Tanaseichuk O. Metascape provides a biologist-oriented resource for the analysis of systems-level datasets. Nat Commun 2019; 10(1):1523. doi: 10.1038/s41467-019-09234-6 [Crossref] [ Google Scholar]
- Chandrashekar DS, Karthikeyan SK, Korla PK, Patel H, Shovon AR, Athar M. UALCAN: an update to the integrated cancer data analysis platform. Neoplasia 2022; 25:18-27. doi: 10.1016/j.neo.2022.01.001 [Crossref] [ Google Scholar]
- Győrffy B. Integrated analysis of public datasets for the discovery and validation of survival-associated genes in solid tumors. Innovation (Camb) 2024; 5(3):100625. doi: 10.1016/j.xinn.2024.100625 [Crossref] [ Google Scholar]
- Barrett T, Wilhite SE, Ledoux P, Evangelista C, Kim IF, Tomashevsky M. NCBI GEO: archive for functional genomics data sets--update. Nucleic Acids Res 2013; 41(D):D991-5. doi: 10.1093/nar/gks1193 [Crossref] [ Google Scholar]
- Chandrashekar DS, Bashel B, Balasubramanya SA, Creighton CJ, Ponce-Rodriguez I, Chakravarthi B. UALCAN: a portal for facilitating tumor subgroup gene expression and survival analyses. Neoplasia 2017; 19(8):649-58. doi: 10.1016/j.neo.2017.05.002 [Crossref] [ Google Scholar]
- Taherkhani A, Moradifar G, Bayat Z, Samadi P, Jamshidi S. A systems biology approach to uncover key genes and pathways mediating progression of leukoplakia to primary oral squamous cell carcinoma. J Oral Maxillofac Surg Med Pathol 2024; 36(1):120-32. doi: 10.1016/j.ajoms.2023.04.005 [Crossref] [ Google Scholar]
- Jamshidi S, Tavangar M, Shojaei S, Taherkhani A. Malignant transformation of normal oral tissue to dysplasia and early oral squamous cell carcinoma: an in-silico transcriptomics approach. Anal Cell Pathol (Amst) 2024; 2024:6260651. doi: 10.1155/2024/6260651 [Crossref] [ Google Scholar]
- Li S, Lu Z, Sun R, Guo S, Gao F, Cao B. The role of SLC7A11 in cancer: friend or foe?. Cancers (Basel) 2022; 14(13):3059. doi: 10.3390/cancers14133059 [Crossref] [ Google Scholar]
- Nath P, Alfarsi LH, El-Ansari R, Masisi BK, Erkan B, Fakroun A. The amino acid transporter SLC7A11 expression in breast cancer. Cancer Biol Ther 2024; 25(1):2291855. doi: 10.1080/15384047.2023.2291855 [Crossref] [ Google Scholar]
- Shan Q, Zhang C, Li Y, Li Q, Zhang Y, Li X. SLC7A11, a potential immunotherapeutic target in lung adenocarcinoma. Sci Rep 2023; 13(1):18302. doi: 10.1038/s41598-023-45284-z [Crossref] [ Google Scholar]
- Vijayashree Priyadharsini J, Paramasivam A. Virtual screening of mutations in antioxidant genes and its putative association with HNSCC: an in-silico approach. Mutat Res 2020; 821:111710. doi: 10.1016/j.mrfmmm.2020.111710 [Crossref] [ Google Scholar]
- Yan Y, Teng H, Hang Q, Kondiparthi L, Lei G, Horbath A. SLC7A11 expression level dictates differential responses to oxidative stress in cancer cells. Nat Commun 2023; 14(1):3673. doi: 10.1038/s41467-023-39401-9 [Crossref] [ Google Scholar]
- Ishida-Yamamoto A, Igawa S, Kishibe M, Honma M. Clinical and molecular implications of structural changes to desmosomes and corneodesmosomes. J Dermatol 2018; 45(4):385-9. doi: 10.1111/1346-8138.14202 [Crossref] [ Google Scholar]
- Di YB, Bao Y, Guo J, Liu W, Zhang SX, Zhang GH. Corneodesmosin as a potential target of oral squamous cell carcinoma. Medicine (Baltimore) 2022; 101(39):e28397. doi: 10.1097/md.0000000000030851 [Crossref] [ Google Scholar]
- Wan Z, Xiong H, Tan X, Su T, Xia K, Wang D. Integrative multi-omics analysis reveals candidate biomarkers for oral squamous cell carcinoma. Front Oncol 2021; 11:794146. doi: 10.3389/fonc.2021.794146 [Crossref] [ Google Scholar]
- Ehrlich F, Laggner M, Langbein L, Burger P, Pollreisz A, Tschachler E. Comparative genomics suggests loss of keratin K24 in three evolutionary lineages of mammals. Sci Rep 2019; 9(1):10924. doi: 10.1038/s41598-019-47422-y [Crossref] [ Google Scholar]
- Gondivkar SM, Yuwanati M, Sarode SC, Gadbail AR, Gondivkar R, Mohsin SF. Malignant transformation in oral submucous fibrosis: tertiary level evidence: an umbrella review. Oral Dis 2024; 30(4):1818-27. doi: 10.1111/odi.14718 [Crossref] [ Google Scholar]
- Gül D, Habtemichael N, Dietrich D, Dietrich J, Gößwein D, Khamis A. Identification of cytokeratin24 as a tumor suppressor for the management of head and neck cancer. Biol Chem 2022; 403(8-9):869-90. doi: 10.1515/hsz-2021-0287 [Crossref] [ Google Scholar]
- Hong Y, Ho KS, Eu KW, Cheah PY. A susceptibility gene set for early onset colorectal cancer that integrates diverse signaling pathways: implication for tumorigenesis. Clin Cancer Res 2007; 13(4):1107-14. doi: 10.1158/1078-0432.Ccr-06-1633 [Crossref] [ Google Scholar]
- Clucas J, Valderrama F. ERM proteins in cancer progression. J Cell Sci 2015; 128(6):1253. doi: 10.1242/jcs.170027 [Crossref] [ Google Scholar]
- Yu L, Zhao L, Wu H, Zhao H, Yu Z, He M. Moesin is an independent prognostic marker for ER-positive breast cancer. Oncol Lett 2019; 17(2):1921-33. doi: 10.3892/ol.2018.9799 [Crossref] [ Google Scholar]
- Pandiar D, Krishnan RP, Ramani P, Anand R, Sarode S. Oral submucous fibrosis and the malignancy arising from it, could best exemplify the concepts of cuproplasia and cuproptosis. J Stomatol Oral Maxillofac Surg 2023; 124(1S):101368. doi: 10.1016/j.jormas.2022.101368 [Crossref] [ Google Scholar]
- Dharini S, Ramani P, Doble M, Ramasubramanian A. Ferroptosis mediated novel drug design approach in the treatment of oral squamous cell carcinoma. Asian Pac J Cancer Prev 2023; 24(7):2321-7. doi: 10.31557/apjcp.2023.24.7.2321 [Crossref] [ Google Scholar]