Avicenna J Dent Res. 16(3):170-176.
doi: 10.34172/ajdr.1800
Original Article
Three-Dimensional Evaluation of Impacted Mandibular Third Molar Angulation and its Impact on Lingual Cortical Bone Thickness: A Retrospective Cone-Beam Computed Tomography Study
Vinutna Nanda Matta 1, *  , Reddy Sudhakara Reddy 1 , Jyothirmai Koneru 1 , Budumuru Ramesh Kumar 1 , Sindhuja Yerrapragada Sindhuja 1 , Sravani Jampana 1
Author information:
1Department of Oral Medicine & Radiology, Vishnu Dental College, Vishnupur, Bhimavaram, West Godavari, Andhra Pradesh, India
Abstract
Background: The removal of impacted lower third molars surgically can cause complications, and the lingual cortical bone thickness in this region becomes a determining factor in the risk of perforation and injury to the lingual nerve (LN). This study was conducted to assess the relationship between different angulations of impacted lower third molars based on Winter’s classification and the thickness of the lingual cortical bone. Variations in lingual cortical bone thickness among the genders were evaluated as well.
Methods: Cone-beam computed tomography (CBCT) scans of 50 impacted lower third molar teeth of 50 patients (26 men and 24 women) were evaluated in this study. The lingual bone thickness surrounding impacted lower mandibular teeth was measured at three key points, namely, the cemento-enamel junction of the second mandibular molar, the mid-root of the impacted third molar, and the root apex of the impacted third molar. Mesiodistal angulation and buccolingual angulations of the impacted mandibular third molars underwent investigation. Statistical analysis was conducted using SPSS 23. Data were analyzed using the independent sample t test, one-way ANOVA, multiple linear regression analysis, and Fisher’s exact test.
Results: There was a statistically significant relationship between the means of lingual cortical bone thickness surrounding the third molars based on Winter’s classification of third molars impacted at mesiodistal angulation (P=0.00). Regarding gender, buccolingual angulation demonstrated a statistically significant relationship among the means of lingual bone thickness around the third molars (P=0.022).
Conclusion: In our study, the thickness of the lingual cortical bone was notably affected in the middle and apical areas of the impacted third molar region. The variable position of the LN near the mandible third molar region was significant in dental procedures due to its proximity. Three-dimensional (3D) imaging CBCT provides preoperative risk assessment that reduces preventable complications that cannot be answered by 2D imaging.
Keywords: Lingual bone, Impacted teeth, Third molars, Lingual nerve, Cone-beam computed tomography
Copyright and License Information
© 2024 The Author(s); Published by Hamadan University of Medical Sciences.
This is an open-access article distributed under the terms of the Creative Commons Attribution License (
https://creativecommons.org/licenses/by/4.0), which permits unrestricted use, distribution, and reproduction in any medium provided the original work is properly cited.
Please cite this article as follows: Nanda MV, Reddy RS, Koneru J, Kumar BR, Sindhuja SY, Jampana S. Three-dimensional evaluation of impacted mandibular third molar angulation and its impact on lingual cortical bone thickness: a retrospective cone-beam computed tomography study. Avicenna J Dent Res. 2024; 16(3):170-176. doi:10.34172/ajdr.1800
Background
The lingual nerve (LN) emerges as a subdivision of the mandibular division of the trigeminal nerve (V3), carrying general somatic afferent (sensory) signals. Its distribution encompasses the mucosa of the mandibular lingual gingiva, the floor of the mouth, and two-thirds of the tongue region. The disruption to LN functionality can lead to changes in salivary secretion on the affected side, as well as a loss of taste sensation in the anterior two-thirds of the tongue (1), along with potential temporary or permanent alterations in general sensory perception in the affected areas, including anaesthesia, paraesthesia, dysesthesia, or hypoesthesia. These sensory deficits may result in speech difficulties, pain, a burning sensation, excessive salivation, and inadvertent tongue biting(2).
The anatomic location of the LN and the mandible third molar area carries substantial clinical significance. The LN is at risk of damage during various surgical procedures such as third molar impactions, jaw deformity procedures, alveolar ridge augmentation, neoplastic lesions excision, and local anaesthesia administration(3).
Several factors contribute to the risk of nerve injury, including the patient’s age, the operator’s experience, the complexity and duration of the procedure, and the degree of impaction. Additional risk factors include lingual flap retraction, bone removal, tooth sectioning, lingual cortical plate perforation, intraoperative nerve exposure, and prolonged operating times (4). Perforation of the lingual plate in the apical region increases the risk of root tip aberration, migration, and LN injury(5).
The third molars, the last teeth that erupt in the oral cavity, often cause challenges due to impaction procedures. Dental professionals evaluate individuals based on clinical symptoms and radiological findings. These molars usually erupt between the ages of 18 and 24; nonetheless, they may experience delays due to factors such as inadequate retromolar space, malpositioning of dental germ, increased bone density, infection, and hereditary influences. Eruption delays can result from local, systemic, and genetic factors (6).
The surgical removal of mandibular third molars is a frequently performed procedure in oral and maxillofacial surgery, presenting varying levels of difficulty and potential complications (7), including neurosensory disturbances such as paraesthesia of the LN and injury of the inferior alveolar nerve, infection, trismus, alveolar osteitis, iatrogenic thermal injury from high-speed bur, and hematoma formation. Mandibular third molar angulation and lingual cortical bone thickness are key factors influencing surgical complexity (8).
Cone-beam computed tomography (CBCT), a three-dimensional (3D) imaging technique in dentistry, overcomes the limitations of traditional 2D imaging by improving the image quality and reducing errors such as the superimposition of anatomical structures, which can lead to distortions and reduce the risk of making diagnostic errors. This technique offers a multiplanar reconstruction of oral and maxillofacial areas with high resolution and accuracy in dimensions. General dentists and specialists utilize CBCT to enhance diagnosis, treatment planning, and visualization of structures in 3D planes (9).
The study was performed to evaluate the relationship between different angulations of impacted lower third molars and the thickness present in the lingual cortical bone. Moreover, its relationship with gender underwent assessment.
Materials and Methods
Patients visiting the Department of Oral Medicine and Radiology for routine diagnostic and therapeutic purposes were included in this study. The study protocol was approved by the Institutional Ethics Committee Review Board, Vishnu Dental College, Bhimavaram, Andhra Pradesh (IECVDC/23/PG01/OMR/IVT/49). The CBCT scans were acquired by a CBCT unit, CRANEX 3D (SOREDEX, PaloDEx Group Oy Nahkelantie, Tuusula Finland), with a flat panel detector and radiation protection for patients and personnel. The scan was set at 90 kVp, 10 mA, with a 4.9-second acquisition time, as recommended by the manufacturer, with a field of view (FOV) of 61 × 41 mm or 61 × 81 mm and a standard resolution of 300 μm voxel size.
All scans were recorded in digital imaging and communications in medicine format using SCANORA software, and CBCT images were analyzed using OnDemand 3D Imaging software, version 5.2. The images were displayed on a 20-inch Dell monitor with a resolution of 1920 × 1080 pixels and a colour depth of 8 bits. The observers can modify the brightness and contrast of the images to achieve optimal viewing conditions.
The patients were assured of confidentiality and a lack of personal information disclosure. The study involved a retrospective evaluation of 50 CBCT images obtained from 50 patients, comprising both males (26) and females (24), aged between 18 and 48 years (Figure 1).
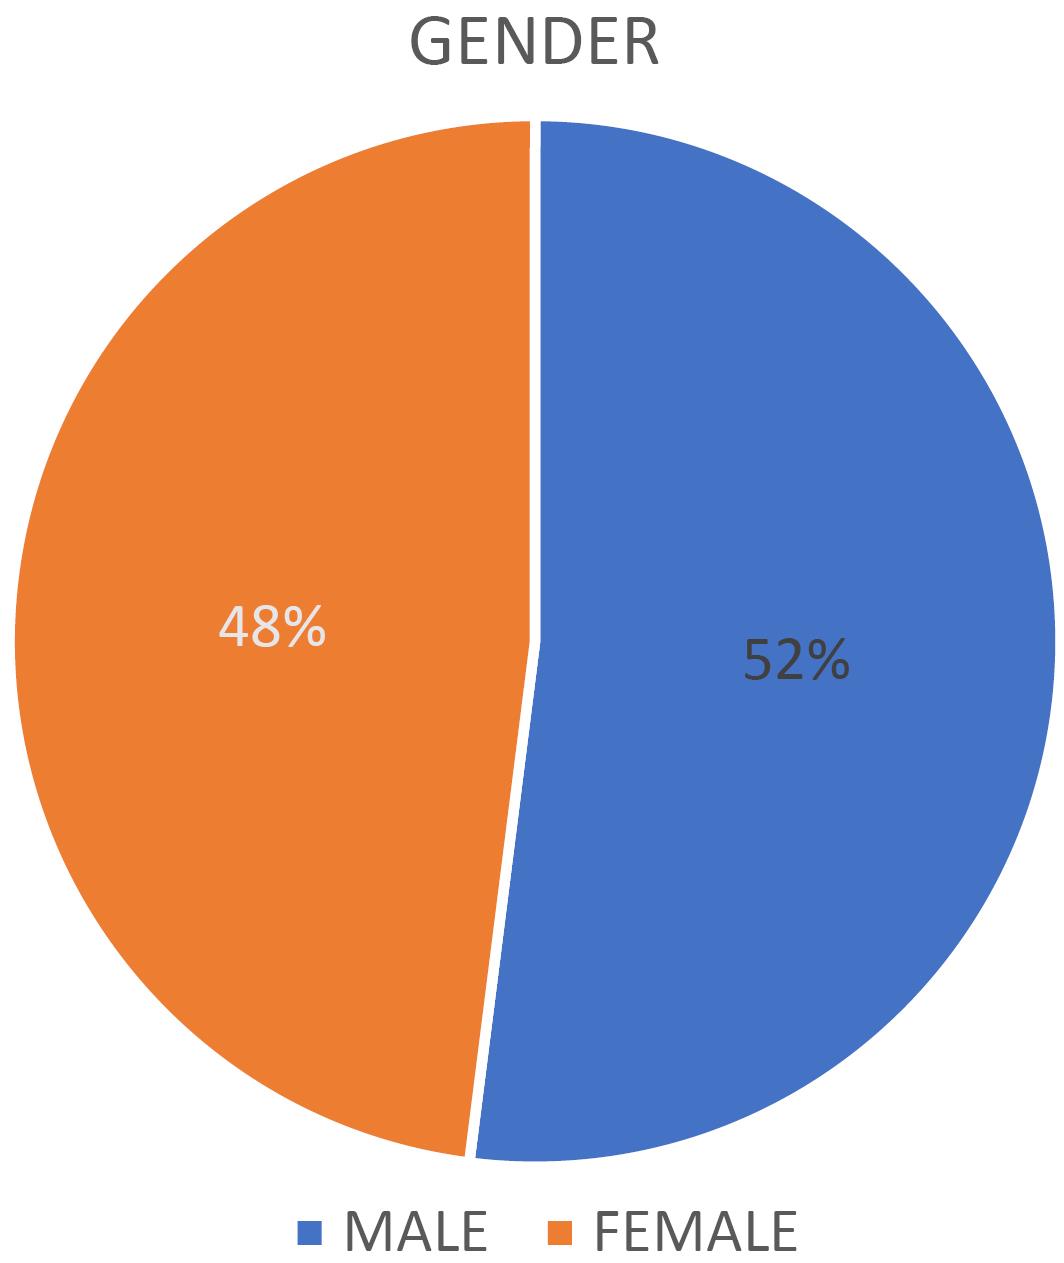
Figure 1.
Gender Distribution
.
Gender Distribution
Subjects fulfilling all the inclusion and exclusion criteria were selected for the assessment. The CBCT scans of the mandible with fully developed impacted third molars, first molars, and second molars were included. Individuals with dental anomalies, absence of first or second molars, pathogenic conditions, and confirmed neurologic sequelae attributable to third molars were excluded from the evaluation. Following Winter’s classification, the CBCT images were classified into mesioangular, distoangular, vertical, and horizontal angulation groups (Figure 2).
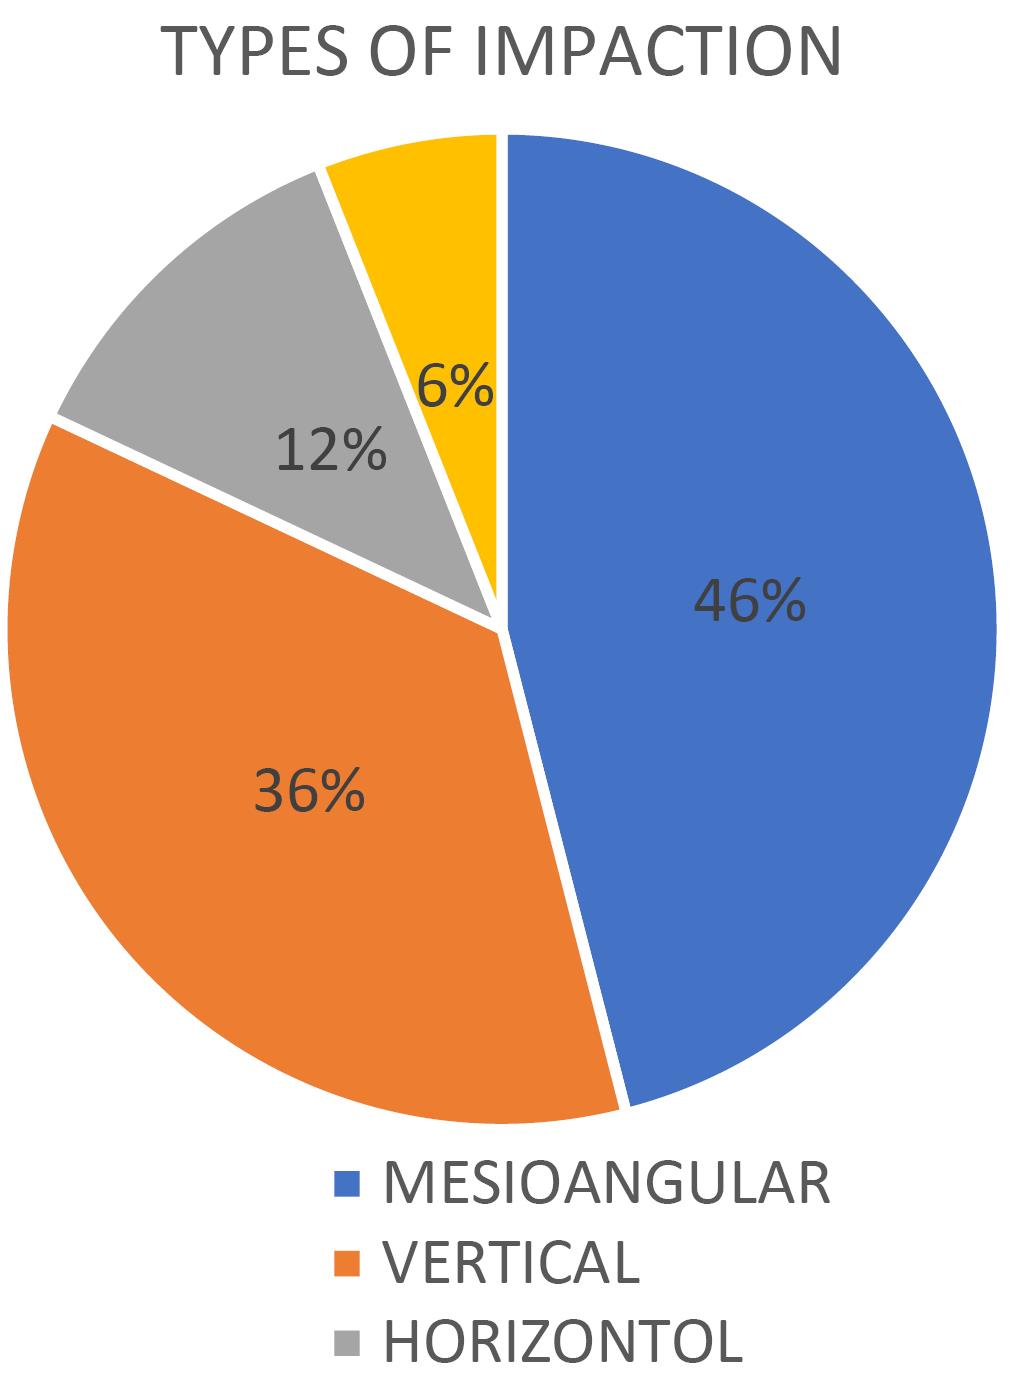
Figure 2.
Impactions Percentage
.
Impactions Percentage
Evaluation of Cone-Beam Computed Tomography Images
Multiple imaging planes, including axial, coronal, and sagittal planes, acquired using CBCT, were used to assess lingual cortical bone thickness surrounding impacted teeth and measure the angulations involving third molars in both mesiodistal and buccolingual dimensions. The lingual cortical bone thickness around impacted teeth was measured at three points, including the cementoenamel junction (CEJ) of the second mandibular molar, the mid-root, and the apex of the impacted third molar root (Figures 3, 4, and 5).
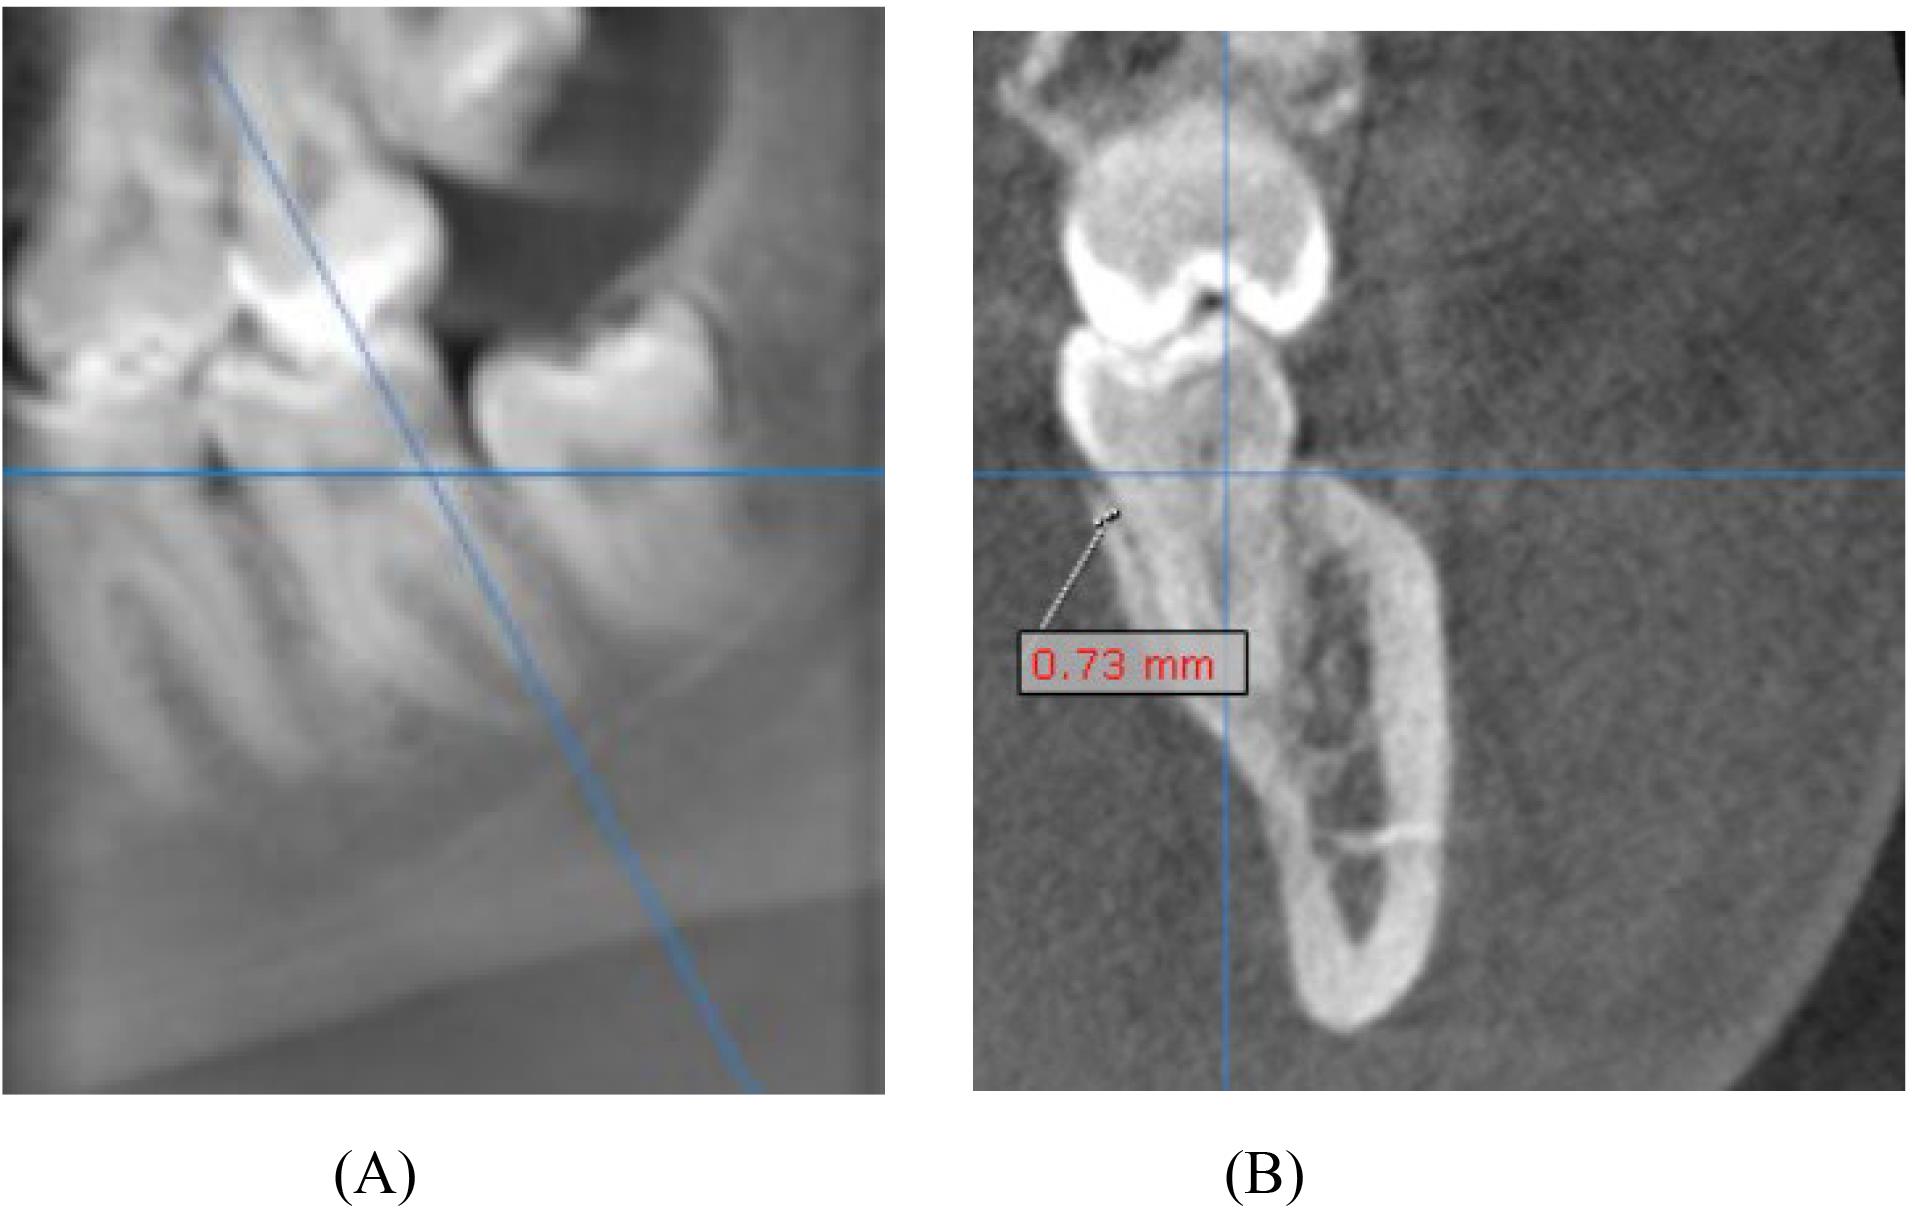
Figure 3.
(A) Panoramic Reconstruction Image Showing the Reference Line Placement and (B) Cross-sectional Image Depicting Lingual Bone Thickness Measured at the Level of the Cementoenamel Junction of the Mandibular Second Molar
.
(A) Panoramic Reconstruction Image Showing the Reference Line Placement and (B) Cross-sectional Image Depicting Lingual Bone Thickness Measured at the Level of the Cementoenamel Junction of the Mandibular Second Molar
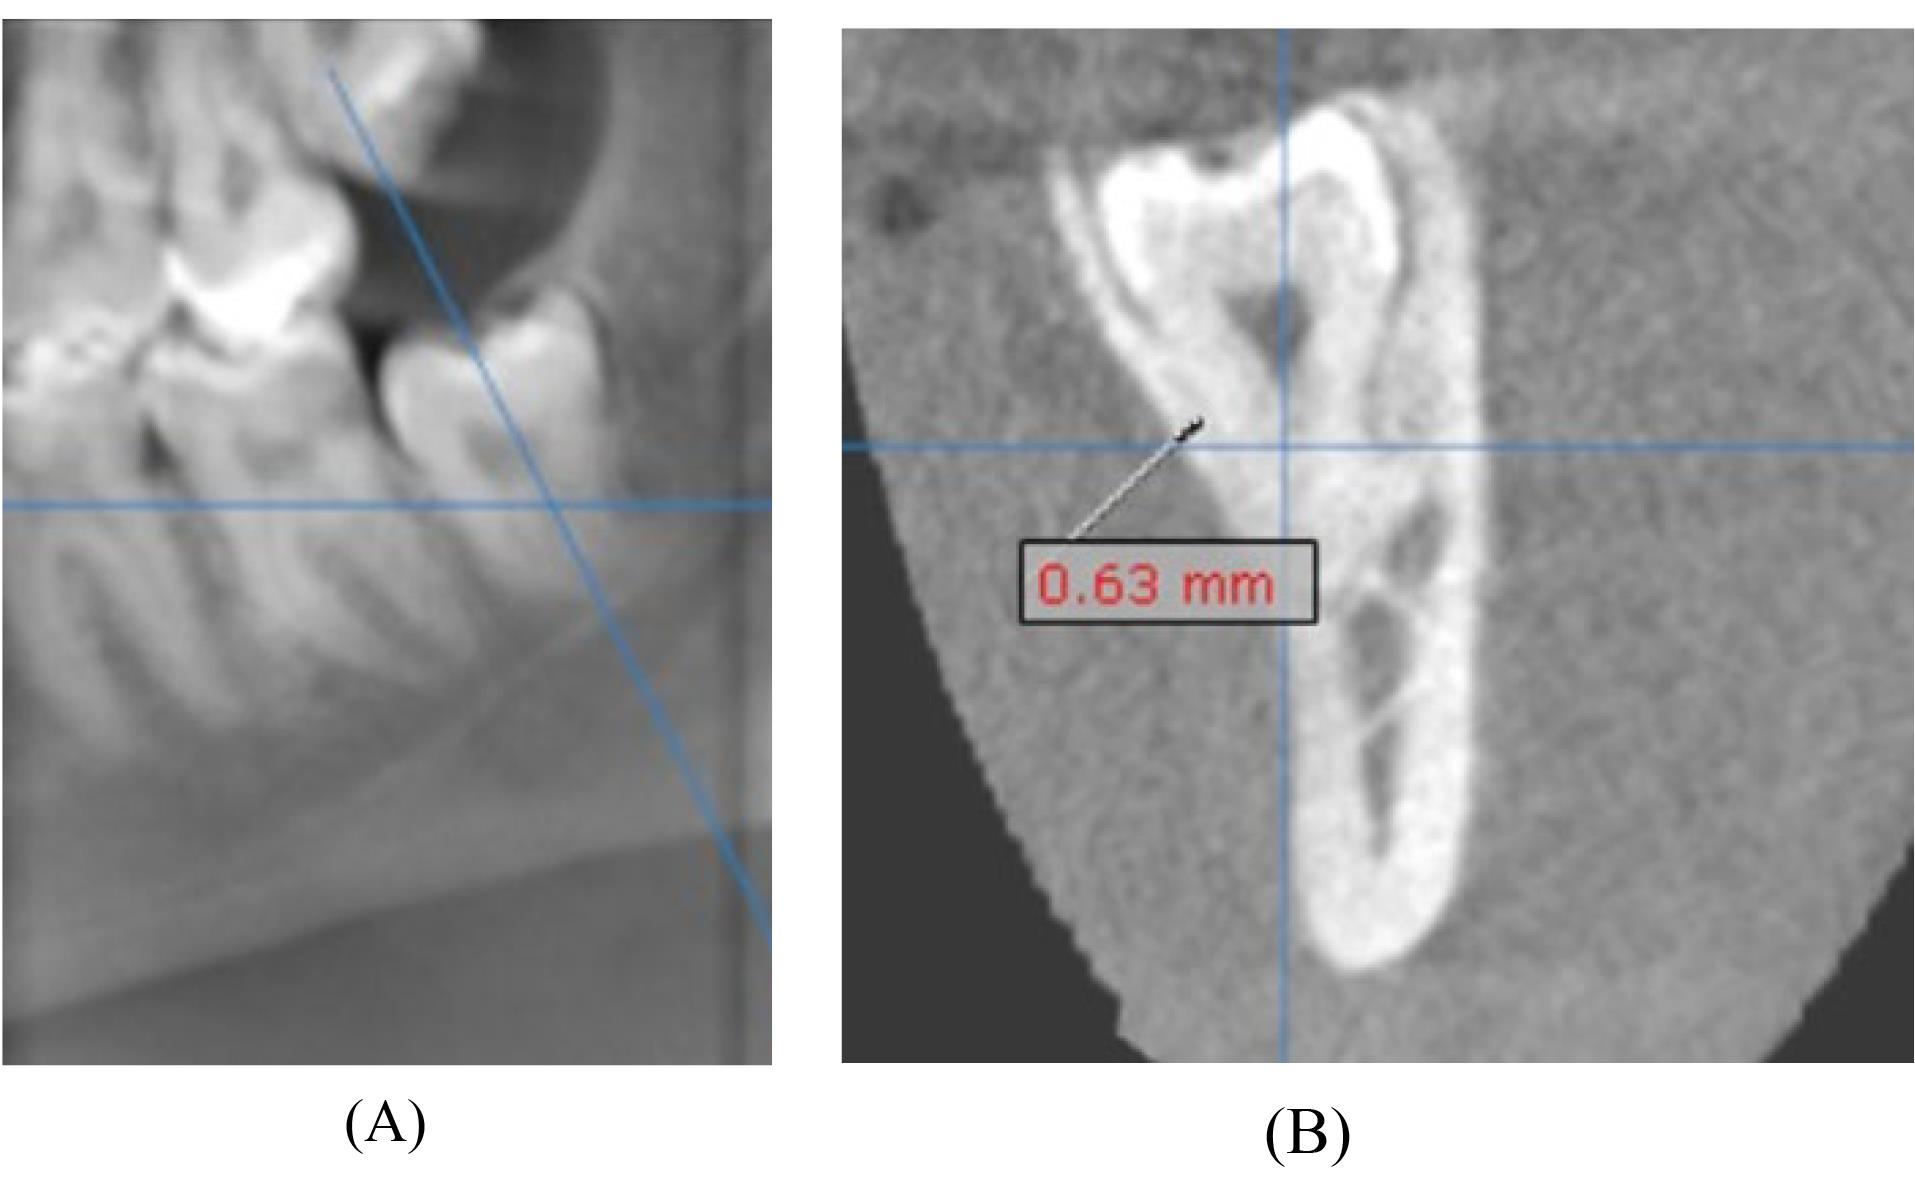
Figure 4.
(A) Panoramic Reconstruction Image Illustrating the Reference Line Placement and (B) Cross-sectional Image Showing Lingual Bone Thickness Measured at the Mid-Root Level of the Impacted Third Molar
.
(A) Panoramic Reconstruction Image Illustrating the Reference Line Placement and (B) Cross-sectional Image Showing Lingual Bone Thickness Measured at the Mid-Root Level of the Impacted Third Molar
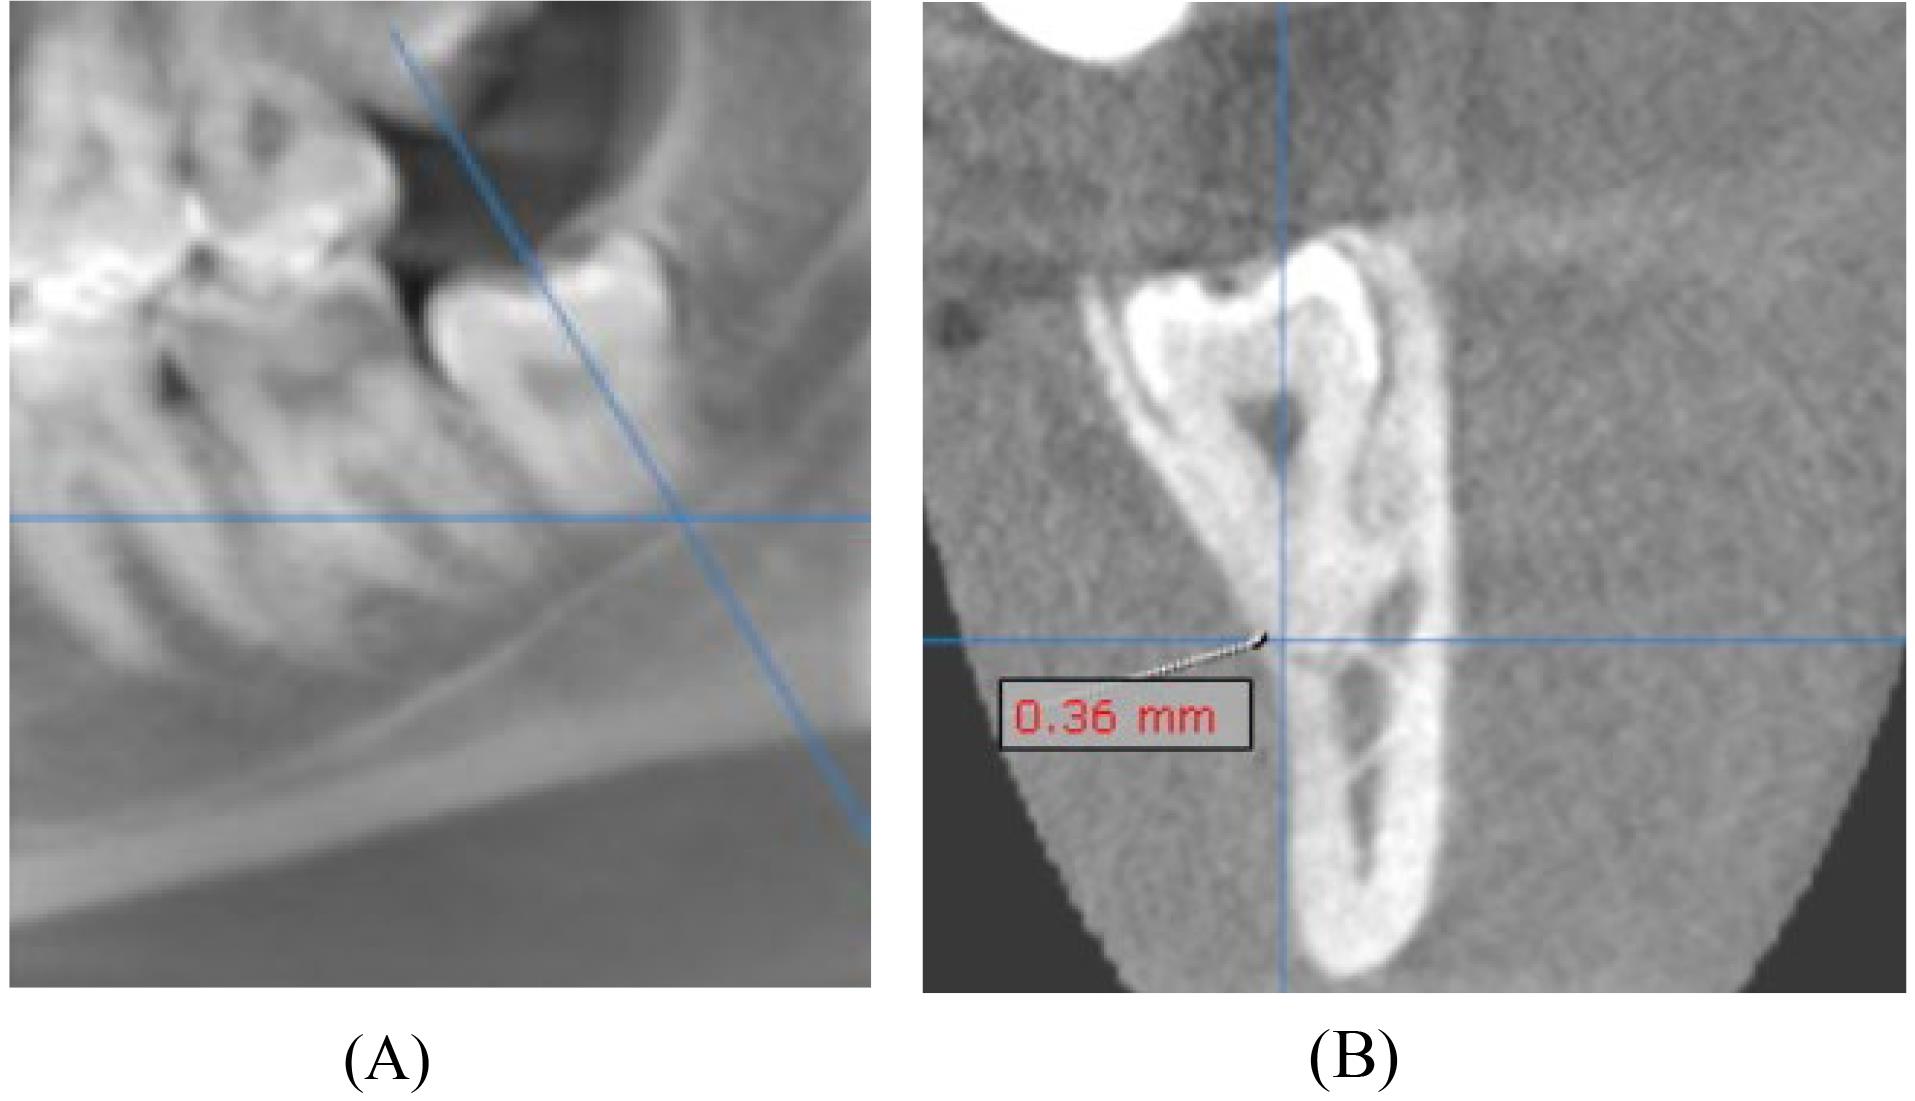
Figure 5.
(A) Reconstructed Panoramic Image Displaying the Reference Line Placement and (B) Cross-sectional Image Illustrating Lingual Bone Thickness Measured at the Apex of the Impacted Third Molar
.
(A) Reconstructed Panoramic Image Displaying the Reference Line Placement and (B) Cross-sectional Image Illustrating Lingual Bone Thickness Measured at the Apex of the Impacted Third Molar
The mesiodistal angulation of the third molar impacted was measured on a sagittal slice in reference to the long axis of the second molar (Figure 6).
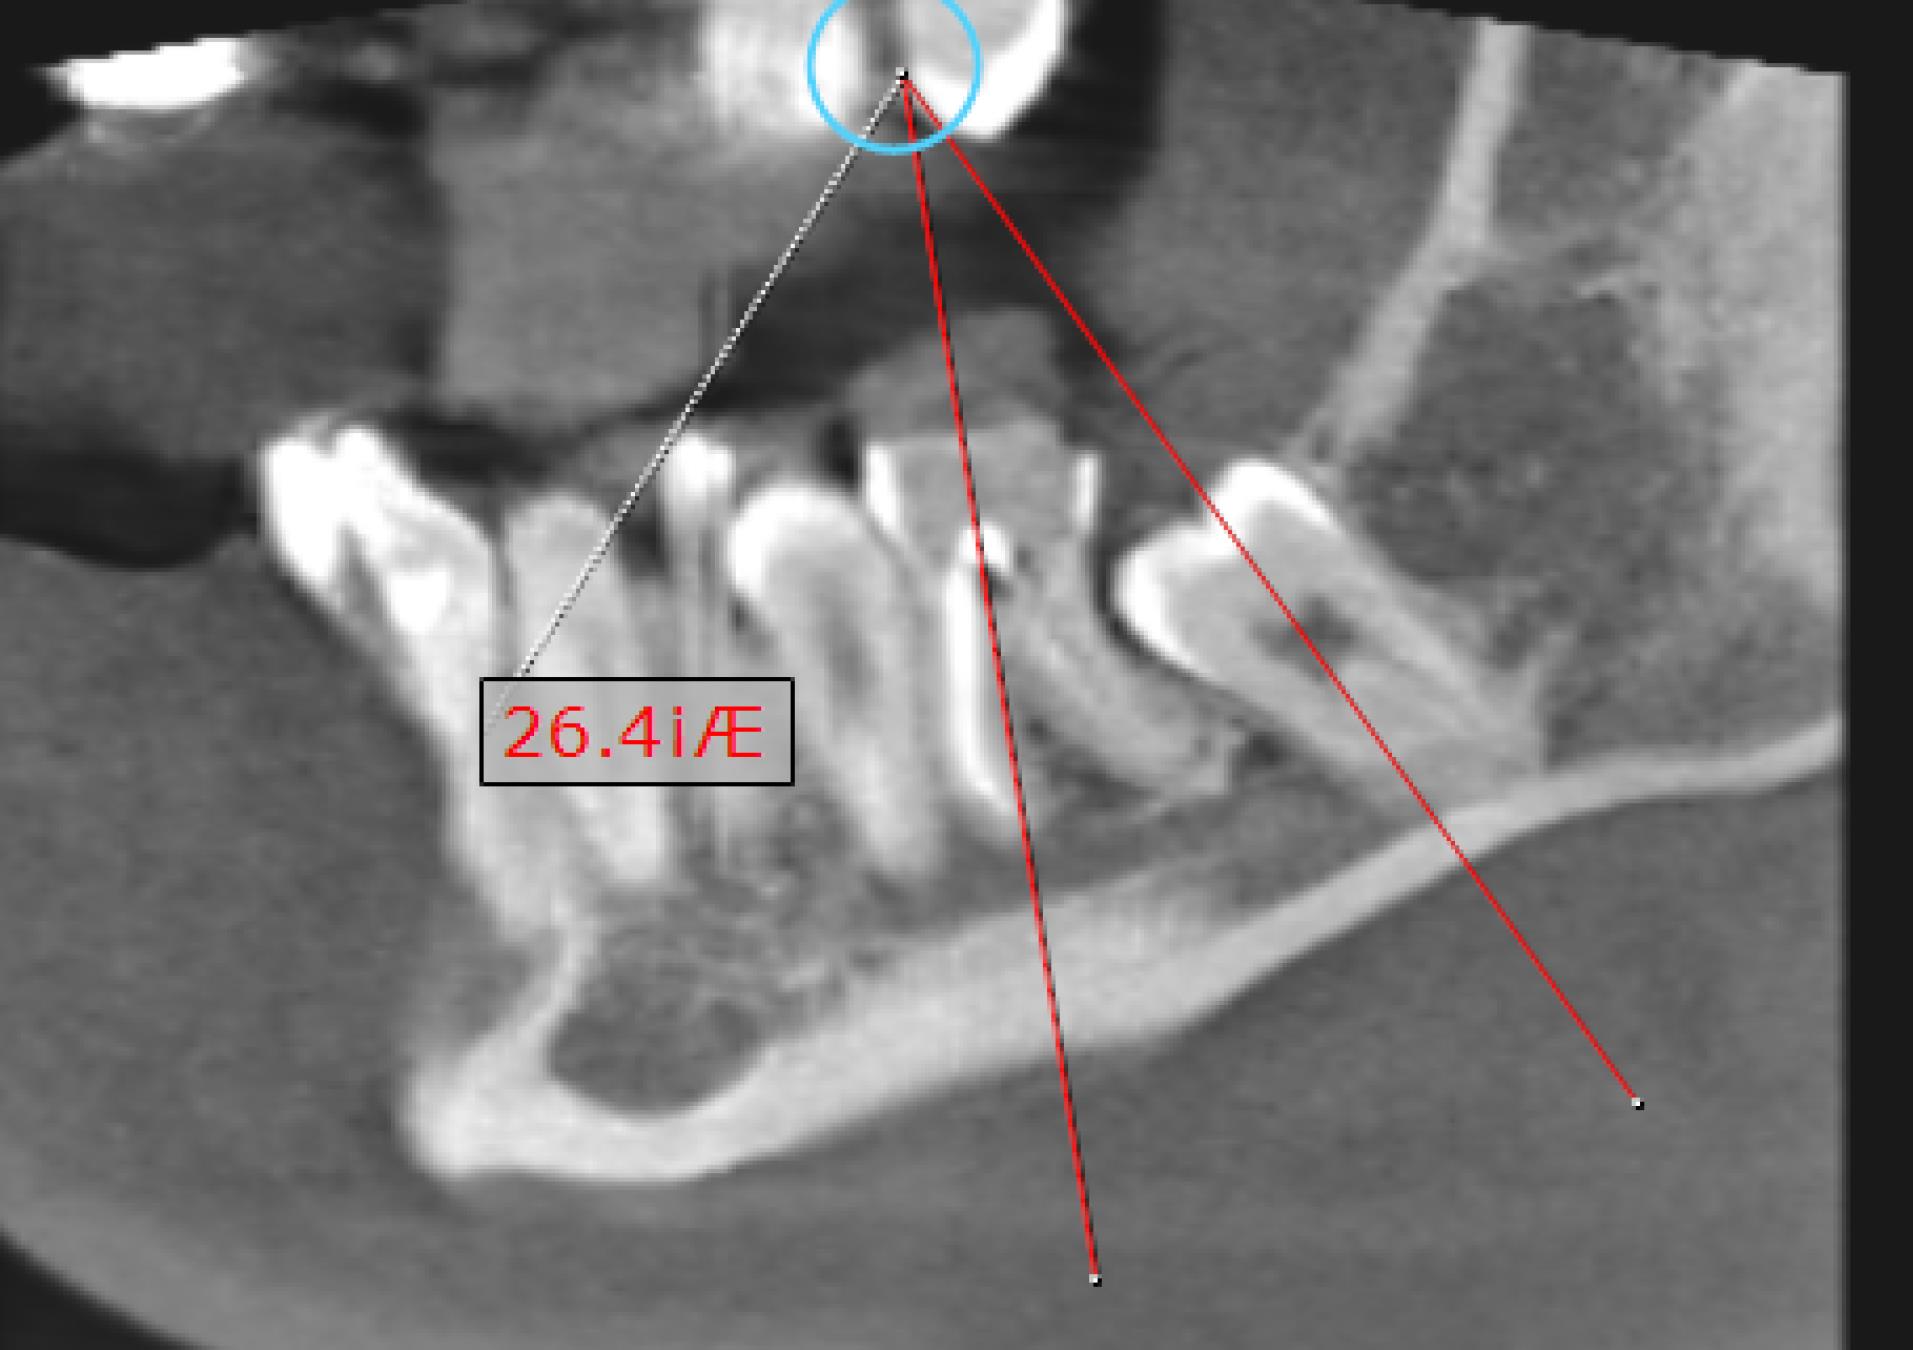
Figure 6.
Sagittal Plane Showing the Measurement of Mesiodistal Angulation of the Impacted Third Molar Measured in Relation to the Long Axis of the Erupted Second Molar
.
Sagittal Plane Showing the Measurement of Mesiodistal Angulation of the Impacted Third Molar Measured in Relation to the Long Axis of the Erupted Second Molar
Axial and coronal slices were selected to measure the impacted molar angulation buccolingually. Axial CBCT slices were prioritized for horizontally angulated molars. On these slices, the buccolingual angulation of the impacted third molar was quantified by measuring the angle from the central axis bisecting the middle of the pulp chambers of the first and second molars, either buccally or lingually. Coronal CBCT slices were selected for vertically angulated molars. The buccolingual angulation was then assessed relative to a reference line bisecting the second molar. This line extended from the central fossa through the midpoint of the second molar’s pulp chamber. The buccolingual angulation of the vertically erupted third molar M3 was measured in relation to the long axis of the second molar M2 (Figure 7).
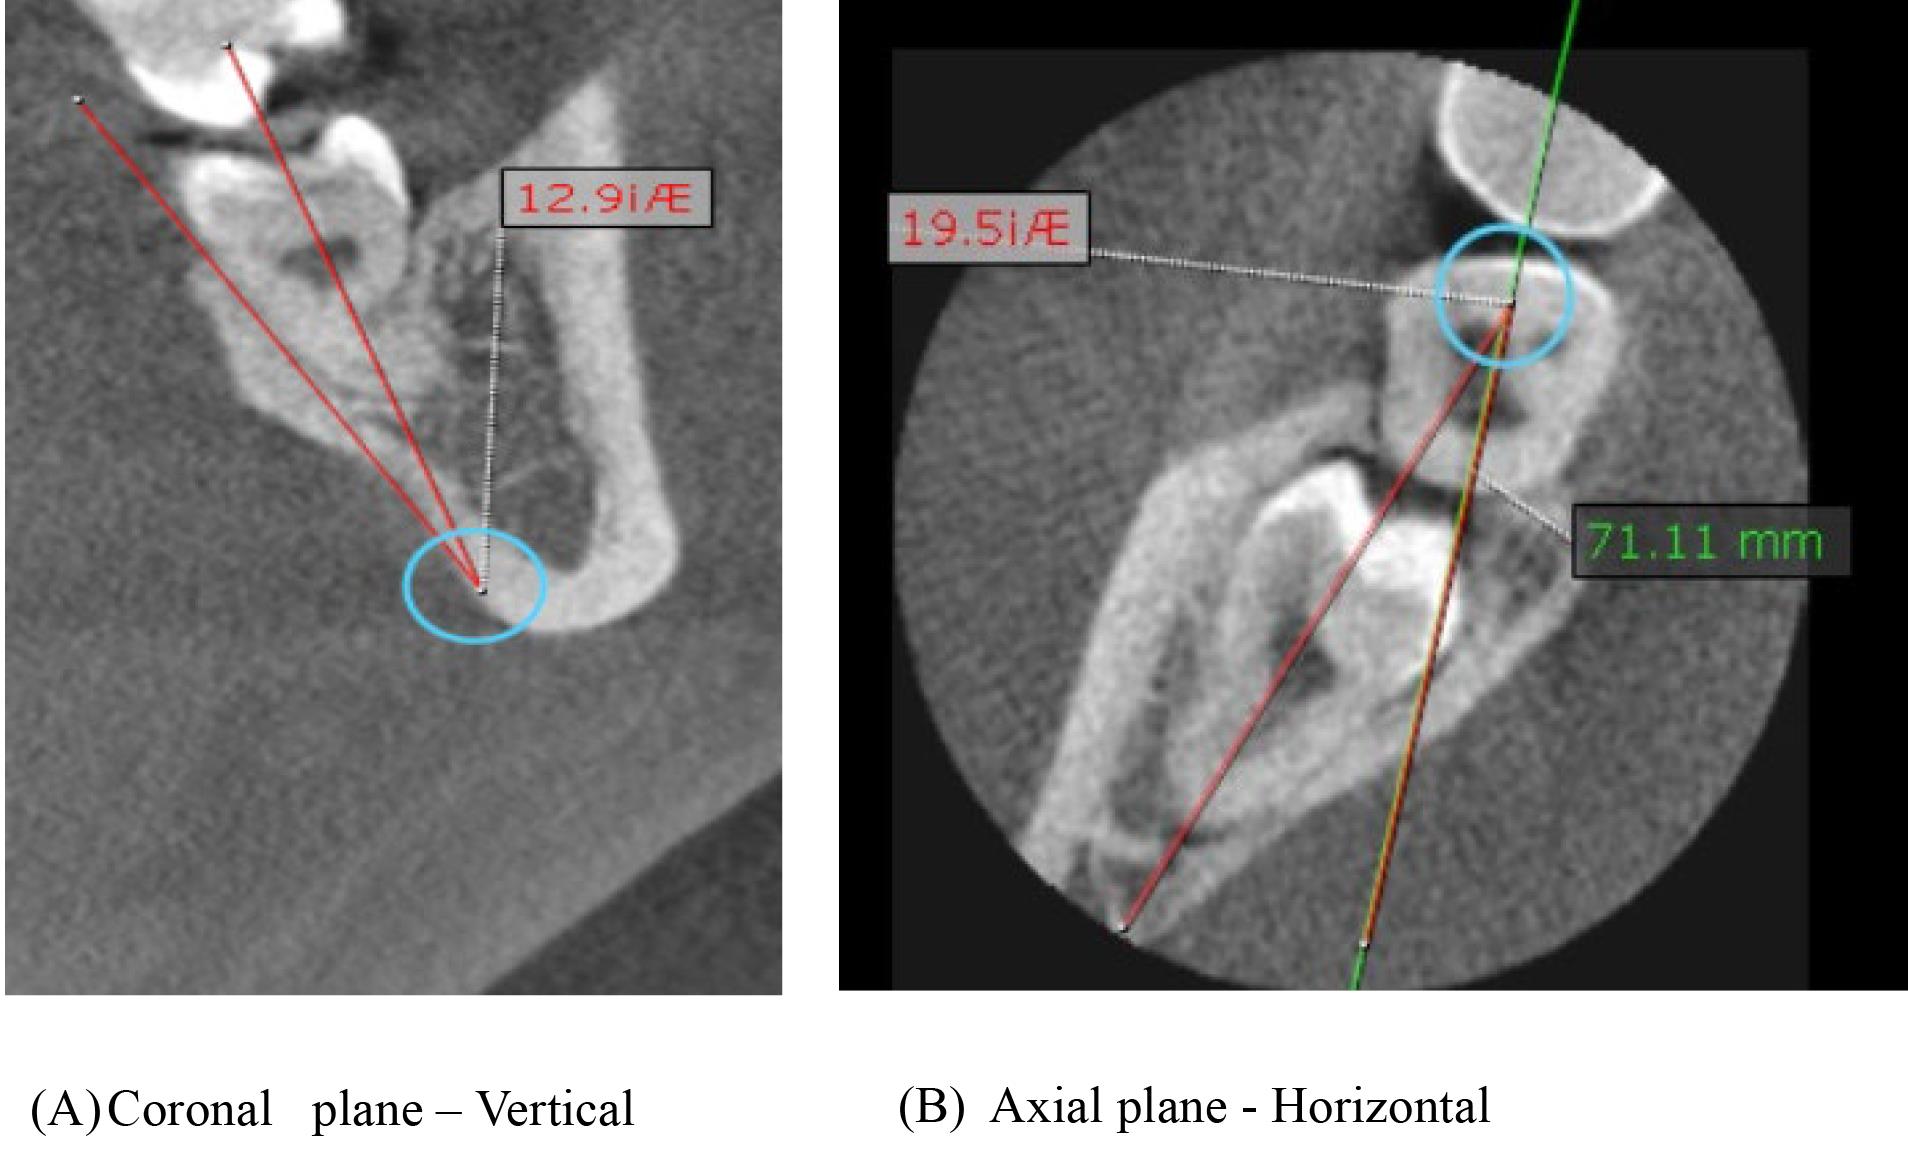
Figure 7.
(A) Coronal CBCT Plane Displaying Measurement of the Buccolingual Angulation of the Vertically Erupted Third Molar Measured in Relation to the Long Axis of the Second Molar and (B) Axial CBCT Plane Showing Measurement of the Buccolingual Angulation of the Horizontally Erupted Third Molar Measured Buccally or Lingually From the Axis Bisecting the Middle of the Pulp Chambers of the First and Second Molars
.
(A) Coronal CBCT Plane Displaying Measurement of the Buccolingual Angulation of the Vertically Erupted Third Molar Measured in Relation to the Long Axis of the Second Molar and (B) Axial CBCT Plane Showing Measurement of the Buccolingual Angulation of the Horizontally Erupted Third Molar Measured Buccally or Lingually From the Axis Bisecting the Middle of the Pulp Chambers of the First and Second Molars
Statistical analysis was performed by utilizing SPSS, version 23. The data were analyzed using the independent samples t test, one-way ANOVA, multiple linear regression analysis, and Fisher’s exact test.
In this study, interclass and intraclass observer agreements were evaluated by two oral medicine and radiology experts, one serving as the primary reader with a teaching experience of 12 years and the other as a postgraduate observer. The aim was to ensure the reliability and consistency of measurements derived from CBCT images. The analysis was performed using the intraclass correlation coefficient, which revealed that intraclass correlation coefficient values exceeded 0.85 for both interclass and intraclass comparisons. This demonstrates the high reliability and reproducibility of our measurement methods, thereby enhancing the validity of the study’s findings.
Results
This study evaluated CBCT images of 50 impacted mandibular third molars from 50 patients, comprising 26 males and 24 females (Figure 1). The participants’ mean age was 25.82 ± 6.44 years (Table 1). According to Winter’s classification, the distribution of impacted teeth demonstrated 46% as mesioangular, 36% as vertical, 6% as distoangular, and 12% as horizontal (Figure 2).
Table 1.
Descriptive Statistics
|
|
N
|
Minimum
|
Maximum
|
Mean
|
Std. Deviation
|
| Age |
50 |
18.00 |
48.00 |
25.8200 |
6.44819 |
| CEJ of second molar |
50 |
0.60 |
2.40 |
1.5076 |
0.43549 |
| Mid-root of third molar |
50 |
0.52 |
2.76 |
1.1468 |
0.52275 |
| Apex of third molar |
50 |
0.00 |
2.14 |
.8192 |
0.50433 |
| Mesiodistal angulation |
50 |
4.40 |
88.00 |
33.9026 |
22.34493 |
| Buccolingual angulation |
50 |
1.60 |
53.00 |
12.3006 |
9.23678 |
| Total |
50 |
|
|
|
|
Note. CEJ: Cementoenamel junction; N: Number; Std. deviation: Standard deviation.
The mean lingual bone thickness at different measured points was 0.60 ± 2.40 mm at the CEJ of the second molar, 0.52 ± 2.76 mm at the mid-root of the third molar, and 0.52 ± 2.14 mm at the apex of the third molar. The mean buccolingual angulation and the mesiodistal angulation were 1.60 ± 53.0° and 4.40 ± 88.0°, respectively (Table 1). According to Winter’s classification of mesiodistal angulation, there was a statistically significant relationship between the mean lingual cortical bone thickness around the third molars (Table 2).
Table 2.
The Mean Thickness of the Lingual Cortical Bone Surrounding Impacted Mandibular Third Molars Based on Winter’s Classification
|
Site
|
N
|
Mean
|
Standard Deviation
|
Standard Error
|
95% CI for Mean
|
Minimum
|
Maximum
|
P
Value
|
|
Lower Limit
|
Upper Limit
|
| CEJ of second molar |
Mesioangular |
23 |
1.5413 |
0.43358 |
0.09041 |
1.3538 |
1.7288 |
0.76 |
2.28 |
0.074 |
| Vertical |
18 |
1.3361 |
0.35999 |
0.08485 |
1.1571 |
1.5151 |
0.6 |
2.2 |
| Distoangular |
3 |
1.59 |
0.63238 |
0.3651 |
0.0191 |
3.1609 |
1.21 |
2.32 |
| Horizontal |
6 |
1.8517 |
0.41672 |
0.17013 |
1.4143 |
2.289 |
1.39 |
2.4 |
| Total |
50 |
1.5076 |
0.43549 |
0.06159 |
1.3838 |
1.6314 |
0.6 |
2.4 |
| Mid-root of third molar |
Mesioangular |
23 |
0.9817 |
0.48763 |
0.10168 |
0.7709 |
1.1926 |
0.52 |
2.76 |
0.056 |
| Vertical |
18 |
1.3006 |
0.56289 |
0.13267 |
1.0206 |
1.5805 |
0.59 |
2.69 |
| Distoangular |
3 |
1.6933 |
0.27465 |
0.15857 |
1.0111 |
2.3756 |
1.47 |
2 |
| Horizontal |
6 |
1.045 |
0.34967 |
0.14275 |
0.678 |
1.412 |
0.58 |
1.5 |
| Total |
50 |
1.1468 |
0.52275 |
0.07393 |
0.9982 |
1.2954 |
0.52 |
2.76 |
| Apex of third molar |
Mesioangular |
23 |
0.6396 |
0.38733 |
0.08076 |
0.4721 |
0.8071 |
0 |
1.36 |
0.053 |
| Vertical |
18 |
0.9639 |
0.62738 |
0.14787 |
0.6519 |
1.2759 |
0 |
2.14 |
| Distoangular |
3 |
1.33 |
0.31432 |
0.18148 |
0.5492 |
2.1108 |
1.11 |
1.69 |
| Horizontal |
6 |
0.8183 |
0.27279 |
0.11137 |
0.5321 |
1.1046 |
0.4 |
1.25 |
| Total |
50 |
0.8192 |
0.50433 |
0.07132 |
0.6759 |
0.9625 |
0 |
2.14 |
| Mesiodistal angulation |
Mesioangular |
23 |
40.87 |
13.11006 |
2.73364 |
35.2008 |
46.5392 |
12.1 |
70 |
0.00 |
| Vertical |
18 |
14.7222 |
6.94877 |
1.63784 |
11.2667 |
18.1778 |
4.4 |
28 |
| Distoangular |
3 |
22.67 |
9.01813 |
5.20662 |
0.2677 |
45.0723 |
14 |
32 |
| Horizontal |
6 |
70.3517 |
26.87959 |
10.97355 |
42.1433 |
98.5601 |
16.3 |
88 |
| Total |
50 |
33.9026 |
22.34493 |
3.16005 |
27.5522 |
40.253 |
4.4 |
88 |
| Buccolingual angulation |
Mesioangular |
23 |
14.4874 |
11.23529 |
2.34272 |
9.6289 |
19.3459 |
2 |
53 |
0.204 |
| Vertical |
18 |
9.8006 |
6.54183 |
1.54192 |
6.5474 |
13.0537 |
1.6 |
26 |
| Distoangular |
3 |
5.6033 |
3.01065 |
1.7382 |
-1.8755 |
13.0822 |
3.3 |
9.01 |
| Horizontal |
6 |
14.7667 |
7.2704 |
2.96813 |
7.1369 |
22.3965 |
7 |
26.2 |
| Total |
50 |
12.3006 |
9.23678 |
1.30628 |
9.6755 |
14.9257 |
1.6 |
53 |
Note. CEJ: Cementoenamel junction.
As regards gender, buccolingual angulation showed a statistically significant relationship with mean lingual bone thickness around the third molars. The inter-gender analysis of lingual bone thickness demonstrated a potential disparity. Females exhibited greater mean lingual bone thickness compared to males at all measurement sites, including the CEJ of the second molar, the mid-root, and the apex of the third molar (Table 3).
Table 3.
Mean Lingual Bone Thickness Around Third Molars According to Gender
|
Site
|
Gender
|
Number
|
Mean
|
Standard Deviation
|
Standard Error Mean
|
Significance (2-Tailed)
|
| CEJ of second molar |
Male |
26 |
1.4696 |
0.40212 |
0.07886 |
0.526 |
| Female |
24 |
1.5487 |
0.47423 |
0.0968 |
0.529 |
| Mid-root of third molar |
Male |
26 |
1.105 |
0.51334 |
0.10067 |
0.562 |
| Female |
24 |
1.1921 |
0.54004 |
0.11024 |
0.562 |
| Apex of third molar |
Male |
26 |
0.8062 |
0.60757 |
0.11915 |
0.851 |
| Female |
24 |
0.8333 |
0.37448 |
0.07644 |
0.849 |
| Mesiodistal angulation |
Male |
26 |
37.7658 |
21.30757 |
4.17876 |
0.206 |
| Female |
24 |
29.7175 |
23.13175 |
4.72175 |
0.208 |
| Buccolingual angulation |
Male |
26 |
15.1508 |
10.41099 |
2.04176 |
0.022 |
| Female |
24 |
9.2129 |
6.69473 |
1.36656 |
0.02 |
Note. CEJ: Cementoenamel junction.
Stepwise multiple linear regression analysis revealed a significant association between the buccolingual angulation of impacted mandibular third molars and lingual cortical bone thickness at the second molar CEJ. Similarly, a significant association was found between mesiodistal angulations and lingual bone thickness at the mid-root of the impacted third molars (Table 4).
Table 4.
Stepwise Multiple Linear Regression Analysis for All Four Angulations of Impacted Mandibular Third Molars
|
Area
|
Explanatory Variables
|
Unstandardized Coefficients
|
Standardized Coefficients
|
T
|
Significance
|
95.0% CI for B
|
|
B
|
Standard Error
|
Beta
|
Lower Bound
|
Upper Bound
|
| Lingual bone thickness at CEJ of second molar |
Mesio distal angulation |
0.005 |
0.003 |
0.263 |
1.914 |
0.062 |
0.000 |
0.011 |
| Bucco lingual angulation |
-0.014 |
0.006 |
-0.305 |
-2.218 |
0.031 |
-0.027 |
-0.001 |
|
|
R2 = 0.136; R--2 = 0.0100; F for R2 (at 2 and 47 df) = 3.708 *; P = 0.032 |
| Lingual bone thickness at the Mid-root of third molar |
Mesio distal angulation |
-0.008 |
0.003 |
-0.342 |
-2.489 |
0.016 |
-0.014 |
-0.002 |
| Bucco lingual angulation |
-0.005 |
0.008 |
-0.087 |
-0.630 |
0.532 |
-0.021 |
0.011 |
|
|
R2 = 0.0134; R--2 = 0.097; F for R2 (at 2 and 47 df) = 3.641*; P = 0.034 |
| Lingual bone thickness at the Apex of root of third molar |
Mesio distal angulation |
-0.005 |
0.003 |
-0.220 |
-1.526 |
0.134 |
-0.012 |
0.002 |
| Bucco lingual angulation |
0.001 |
0.008 |
0.027 |
0.188 |
0.851 |
-0.014 |
0.017 |
|
|
R2 = 0.47; R--2 = 0.07; F for R2 (at 2 and 47 df) = 1.167*; P = 0.320 |
Note. CEJ: Cementoenamel junction.
There was a statistically significant relationship between Winter’s classification of impacted third molars and lingual bone thinning at the mid-root level and apex of the third molar (P = 0.031, P = 0.025) (Table 5).
Table 5.
The Distribution of Lingual Bone Thinning to the Winter’s Classification of Impacted Mandibular Third Molars
|
|
Winter’s Classification (N=50)
|
P
Value
|
|
|
Mesioangular
(n=23)
|
Vertical
(n=18)
|
Distoangular
(n=3)
|
Horizontal
(n=6)
|
|
| Lingual-bone thinning (thickness < 1 mm) at CEJ of the second molar (N) |
2 |
2 |
0 |
0 |
1.0 |
| Lingual bone thinning around CEJ of the mandibular second molar (N%) |
8.7% |
11.1% |
0 |
0 |
| Lingual-bone thinning (thickness < 1 mm) at the mid-root of impacted third molar (N) |
16 |
6 |
0 |
3 |
0.031 |
| Lingual bone thinning around mid-root of the mandibular third molar (N%) |
69.6% |
33.3% |
0 |
50% |
| Lingual-bone thinning (thickness < 1 mm) at the apex of impacted third molar (N) |
19 |
11 |
0 |
5 |
0.025 |
| Lingual bone thinning around the apex of mandibular third molar at (N%) |
82.6% |
61.1% |
0 |
83.3% |
Note. CEJ: Cementoenamel junction.
Mesioangularly impacted teeth represented more thinning of the lingual bone at the mid-root level. In contrast, horizontally impacted teeth tended to cause more pronounced thinning of the lingual bone at the apex level compared to the other positions of impaction (Table 5). According to Winter’s classification, at the mid-root level of impacted third molars, the lingual bone was the thinnest for mesioangular (69.6%), followed by horizontal (50%) and vertical (33.3%) teeth. At the apex of impacted third molars, horizontal teeth had the thinnest lingual bone (83.3%), followed by mesioangular (82.6%) and vertical (61.1%), respectively (Table 5).
Discussion
The management of impacted mandibular third molars induces a potential iatrogenic injury to the LN during surgical procedures (10). The lingual cortical bone represents the primary structural barrier separating the lower third molar and the LN. Injury to this nerve can cause temporary or permanent alterations in lingual sensory function on the affected side. The thicker cortical bone in this region may serve a protective function for these vital structures.
According to Huang et al (11), lingual cortical plate thickness at the mid-root of impacted third molars (1.49 mm) exhibited lesser thickness than that at the root apex. In the present study, the mean thickness of the lingual cortical bone at the mid-root and the apex of the impacted mandibular third molar root was measured to be 1.14 mm and 0.81 mm, respectively, and the thickness at the root apex of the third molar was found to be less than at the mid-root region, which contradicts the result of the current study (Table 2). Tolstunov et al (4) reported that the cortical lingual bone tends to be thicker at the mid-root level compared to the apex, which conforms to our findings. This discrepancy may be due to variations in anatomical structures in lingual cortical plate thickness among the study populations.
Based on the findings of Menziletoglu et al (12), variations in the mean lingual cortical bone thickness surrounding impacted mandibular third molars, according to Winter’s classification of impacted third molars, were evident only at the mid-root level among horizontal, mesioangular, distoangular, and vertical angulations. In the present study, there were no statistically significant differences in thickness at the mid-root region of impacted third molars (Table 2). This lack of significance could be attributed to anatomical variability and sample homogeneity within the study population.
The results of the study by Gumber et al (13) revealed that mean lingual bone thickness among genders had a significant effect on the mid-root of the second molar, which does not match the findings of our study, indicating statistically significant changes. According to Tolstunav et al (4), lingual cortical bone thickness considerably differed among males and females, as cortical bone thickness increased in women than in men. Similarly, Wang et al (14) found that the lingual cortical bone was generally thicker in females at the apex level when compared to males. Cheung et al (15) reported no significant correlation between patient gender and the incidence of LN injury. In our study, the mean thickness of lingual cortical bone was almost identical and statistically insignificant among males and females (Table 3). The possible explanation may be population homogeneity, environmental growth factors, or a limited sample size.
According to Menziletoglu et al (12), there was a statistically significant relationship between Winter’s classification of impacted third molars and thinning of lingual bone, primarily observed at the mid-root level. Horizontally impacted teeth exhibited significantly pronounced thinning of the lingual bone at the mid-root level compared to the other positions of impaction. Our findings demonstrated a statistically significant correlation between Winter’s classification of impacted third molars and lingual bone thinning at the mid-root level and even at the apical portions of the impacted root. Mesioangular impacted teeth (69.6%) exhibited greater lingual bone thinning at the mid-root level, and horizontally impacted teeth (83.3%) represented significantly pronounced thinning of the lingual bone at the apical portions of the impacted root compared to other impaction positions (Table 5). The lingual bone was thin at the mid-root region, primarily affecting mesioangular impactions, followed by horizontal and vertical impacted teeth. Similarly, the lingual bone was thin at the apical region, mostly affected by horizontal and mesioangular impactions, followed by vertical impacted teeth. These inconsistent results could be related to variations in bone density and thickness within the mandible, different case selections, and the size of the sample.
Utilizing the CBCT data, it was possible to accurately determine the relationship between the roots of impacted teeth and the lingual bone, as CBCT was unable to visualize soft tissues, including the LN. This study had some limitations. The thickness of the lingual cortical bone was only evaluated in the study without prospective analysis. Furthermore, the distribution of impacted mandibular third molars exhibited heterogeneity with an uneven distribution across the four angulation groups. This disparity occurred primarily due to the sample size constraints and the potential for sample bias.
The thickness of the lingual cortical bone was measured at the level of the CEJ of the mandibular second molar, especially its distolingual portion closest to the impacted third molar. The literature suggests that the proximity of the second molar helps evaluate the thickness of the lingual cortical bone. The angulation and position of impacted third molars can directly influence the adjacent second molar and surrounding bone structures, making it a reference point for analysis. The second molar serves as a reference point that allows for precise measurements and evaluations of the bone thickness involving the impacted third molar.
Conclusion
In our study, the lingual cortical bone thickness at the middle and apical portions of the impacted third molar region was the most affected. The lingual bone was thin at the mid-root region, primarily influencing mesioangular impactions followed by horizontally and vertically impacted teeth. Similarly, the lingual bone was thin at the apical region, primarily affecting horizontal and mesioangular impactions, followed by vertical impacted teeth. The variable position of the LN near the mandible third molar region was significant in dental procedures due to its proximity. Accurate knowledge of the nerve’s location within the third molar region is crucial for planning and successful surgical intervention. Preoperative assessment of the lingual cortical bone thickness in the impacted third molar region using CBCT serves as a critical determinant for predicting the risk of iatrogenic LN injury during surgical procedures. 3D imaging CBCT can reduce the preventable complications that cannot be answered by 2D imaging.
Author’s Contribution
Conceptualization: Vinutna Nanda Matta, Reddy Sudhakara Reddy.
Data curation: Vinutna Nanda Matta.
Formal analysis: Vinutna Nanda Matta.
Funding acquisition: Vinutna Nanda Matta.
Investigation: Vinutna Nanda Matta.
Methodology: Vinutna Nanda Matta, Budumuru Ramesh Kumar.
Project administration: Vinutna Nanda Matta.
Resources: Vinutna Nanda Matta, Sindhuja Yerrapragada Sindhuja.
Software: Vinutna Nanda Matta, Budumuru Ramesh Kumar.
Supervision: Vinutna Nanda Matta, Reddy Sudhakara Reddy.
Validation: Vinutna Nanda Matta.
Visualization: Vinutna Nanda Matta, Sravani Jampana.
Writing–original draft: Vinutna Nanda Matta, Jyothirmai Koneru.
Writing–review & editing: Vinutna Nanda Matta, Jyothirmai Koneru.
Competing Interests
The authors declare that they have no conflict of interests.
Ethical Approval
This study was approved by the Institutional Ethics Committee Review Board, Vishnu Dental College, Bhimavaram, Andhra pradesh (IECVDC/23/PG01/OMR/IVT/49).
Funding
This research received no specific grant from funding agencies in the public, commercial, or not-for-profit sectors.
References
- Chan HL, Leong DJ, Fu JH, Yeh CY, Tatarakis N, Wang HL. The significance of the lingual nerve during periodontal/implant surgery. J Periodontol 2010; 81(3):372-7. doi: 10.1902/jop.2009.090506 [Crossref] [ Google Scholar]
- Loescher AR, Smith KG, Robinson PP. Nerve damage and third molar removal. Dent Update 2003; 30(7):375-82. doi: 10.12968/denu.2003.30.7.375 [Crossref] [ Google Scholar]
- Karakas P, Uzel M, Koebke J. The relationship of the lingual nerve to the third molar region using radiographic imaging. Br Dent J 2007; 203(1):29-31. doi: 10.1038/bdj.2007.584 [Crossref] [ Google Scholar]
- Tolstunov L, Brickeen M, Kamanin V, Susarla SM, Selvi F. Is the angulation of mandibular third molars associated with the thickness of lingual bone?. Br J Oral Maxillofac Surg 2016; 54(8):914-9. doi: 10.1016/j.bjoms.2016.06.005 [Crossref] [ Google Scholar]
- Özkan G, Demetoğlu U. Evaluation of lingual cortical bone thickness of the mandibular third molars using CBCT. Ege Üniv Diş Hekim Fak Derg 2020; 41(2):143-7. doi: 10.5505/eudfd.2020.22599 [Crossref] [ Google Scholar]
- Juodzbalys G, Daugela P. Mandibular third molar impaction: review of literature and a proposal of a classification. J Oral Maxillofac Res 2013; 4(2):e1. doi: 10.5037/jomr.2013.4201 [Crossref] [ Google Scholar]
- Mallick A, Vidya KC, Waran A, Rout SK. Measurement of lingual cortical plate thickness and lingual position of lower third molar roots using cone beam computed tomography. J Int Soc Prev Community Dent 2017; 7(Suppl 1):S8-12. doi: 10.4103/jispcd.JISPCD_106_17 [Crossref] [ Google Scholar]
- Emes Y, Oncu B, Aybar B, Al-Badri N, Işsever H, Atalay B. Measurement of the lingual position of the lower third molar roots using cone-beam computed tomography. J Oral Maxillofac Surg 2015; 73(1):13-7. doi: 10.1016/j.joms.2014.06.460 [Crossref] [ Google Scholar]
- Matsuda S, Yoshimura H. Lingual bone thickness in the apical region of the horizontal mandibular third molar: a cross-sectional study in young Japanese. PLoS One 2022; 17(1):e0263094. doi: 10.1371/journal.pone.0263094 [Crossref] [ Google Scholar]
- Meshram VS, Meshram PV, Lambade P. Assessment of nerve injuries after surgical removal of mandibular third molar: a prospective study. Asian J Neurosci 2013; 2013(1):291926. doi: 10.1155/2013/291926 [Crossref] [ Google Scholar]
- Huang C, Zhou C, Xu M, Zou D. Risk factors for lingual plate fracture during mandibular third molar extraction. Clin Oral Investig 2020; 24(11):4133-42. doi: 10.1007/s00784-020-03286-5 [Crossref] [ Google Scholar]
- Menziletoglu D, Tassoker M, Kubilay-Isik B, Esen A. The assesment of relationship between the angulation of impacted mandibular third molar teeth and the thickness of lingual bone: a prospective clinical study. Med Oral Patol Oral Cir Bucal 2019; 24(1):e130-5. doi: 10.4317/medoral.22596 [Crossref] [ Google Scholar]
- Gumber TK, Kandiara P, Bhullar RS, Dhawan A, Kapila S, Singh B. Assessment and correlation of variation in lingual cortical plate thickness with different angulations of impacted mandibular third molar using cone beam computed tomography in North Indian population. J Maxillofac Oral Surg 2023; 22(3):590-602. doi: 10.1007/s12663-022-01835-x [Crossref] [ Google Scholar]
- Wang D, He X, Wang Y, Zhou G, Sun C, Yang L. Topographic relationship between root apex of mesially and horizontally impacted mandibular third molar and lingual plate: cross-sectional analysis using CBCT. Sci Rep 2016; 6:39268. doi: 10.1038/srep39268 [Crossref] [ Google Scholar]
- Cheung LK, Leung YY, Chow LK, Wong MC, Chan EK, Fok YH. Incidence of neurosensory deficits and recovery after lower third molar surgery: a prospective clinical study of 4338 cases. Int J Oral Maxillofac Surg 2010; 39(4):320-6. doi: 10.1016/j.ijom.2009.11.010 [Crossref] [ Google Scholar]