Avicenna J Dent Res. 15(1):23-26.
doi: 10.34172/ajdr.2023.1699
Policy Brief
A Policy Brief on Improving the Prognosis of Patients With Oral Squamous Cell Carcinoma
Amir Taherkhani 1  , Zohre Farhadi 2 , Shahab Shahmoradi Dehto 3 , Shokoofeh Jamshidi 4 , Zeynab Bayat 2, * , Setareh Shojaei 3, *
Author information:
1Research Center for Molecular Medicine, Hamadan University of Medical Sciences, Hamadan, Iran
2Department of Oral and Maxillofacial Medicine, School of Dentistry, Hamadan University of Medical Sciences, Hamadan, Iran
3Department of Oral and Maxillofacial Pathology, School of Dentistry, Hamadan University of Medical Sciences, Hamadan, Iran
4Department of Oral and Maxillofacial Pathology, School of Dentistry, Dental Research Center, Hamadan University of Medical Sciences, Hamadan, Iran
Copyright and License Information
© 2023 The Author(s); Published by Hamadan University of Medical Sciences.
This is an open-access article distributed under the terms of the Creative Commons Attribution License (
http://creativecommons.org/licenses/by/4.0), which permits unrestricted use, distribution, and reproduction in any medium provided the original work is properly cited.
Please cite this article as follows: Taherkhani A, Farhadi Z, Shahmoradi Dehto S, Jamshidi S, Bayat Z, Shojaei S. A policy brief on improving the prognosis of patients with oral squamous cell carcinoma. Avicenna J Dent Res. 2023; 15(1):23-26. doi:10.34172/ajdr.2023.1699
Background
Oral cancer is the most malignancy in the head and neck region (1), and oral squamous cell carcinoma (OSCC) accounts for the most significant proportion of cancers in the oral cavity (2). OSCC is the sixth most common carcinoma worldwide, affecting 350 000 patients across the globe each year, leading to approximately 50% of individual deaths. The most risk factors of OSCC are smoking tobacco, consuming alcoholic drinks, and human papillomavirus infections (3,4). Currently, tumor excision, radiotherapy, chemoradiation therapy, and immunotherapy using cetuximab/PD-1 are gold standard approaches for OSCC treatment (5).
Significance of the Subject/Study
Despite developments in therapeutic approaches, the 5-year survival rate of patients with OSCC has remained at ~ 50%, demonstrating the poor outcome of patients affected by the disease. Several reasons have been reported for poor prognosis and the high morbidity rate of patients with OSCC, including patients’ common diagnosis in the late stage of the disease, drug resistance, distant metastasis, and tumor recurrence (6-22). Therefore, it is necessary to predict the outcome of patients with OSCC, probably resulting in the most appropriate treatment decision.
Policy Options
Cancer biomarkers are molecules that are either produced by cancer cells or secreted in response to tumor cells. Three main classes have been introduced for biomarkers, including diagnostic, predictive, and prognostic markers. Prognostic markers inform the overall survival of patients (23,24). Thus, identifying critical markers for predicting the development of tumors and outcome could lead to the most suitable treatment of a disease. Due to the significant role of prognostic markers in the pathogenesis of conditions, they could also be assigned drug targets for therapeutic goals in future studies (19,25-28).
Previous reports have introduced several genes as prognostic markers in patients with OSCC (29,30). Biomarkers could either be used as a single gene (Table 1) or a combination of features (Table 2), each of which has its benefits and limitations. A prognosis with a single gene is less costly than a combination of genes. However, a combined panel might produce a more reliable, accurate, and specific result (31).
Table 1.
Prognostic Biomarkers in OSCC
|
Gene Symbol
|
P (Log-Rank Test)
|
HR (High)
|
P (HR)
|
Description of the Study Identifying the Markers
|
Reference
|
| EGF |
0.00078 |
1.6 |
0.0009 |
Poor prognosis OSCC vs. favorable prognosis OSCC |
(29) |
| CALM1 |
0.001 |
1.6 |
0.0011 |
Primary OSCC vs. healthy control |
(30) |
| RTN4 |
0.0014 |
1.5 |
0.0015 |
Poor prognosis OSCC vs. favorable prognosis OSCC |
(29) |
| RAN |
0.0019 |
1.5 |
0.0021 |
Poor prognosis OSCC vs. favorable prognosis OSCC |
(29 |
| ACTB |
0.0054 |
1.5 |
0.0057 |
Poor prognosis OSCC vs. favorable prognosis OSCC |
(29) |
| CYCS |
0.009 |
1.4 |
0.0096 |
Primary OSCC vs. healthy control & poor prognosis OSCC vs. favorable prognosis OSCC |
(29,30) |
| H2AFZ |
0.013 |
1.4 |
0.013 |
Poor prognosis OSCC vs. favorable prognosis OSCC |
(29) |
| RPL9 |
0.015 |
1.4 |
0.016 |
Poor prognosis OSCC vs. favorable prognosis OSCC |
(29) |
| CCT6A |
0.018 |
1.4 |
0.019 |
Primary OSCC vs. healthy control |
(30) |
| CDC27 |
0.02 |
1.4 |
0.02 |
Poor prognosis OSCC vs. favorable prognosis OSCC |
|
| THBS1 |
0.0099 |
1.4 |
0.01 |
Primary OSCC vs. healthy control |
(30) |
| MYC |
0.028 |
1.3 |
0.029 |
Primary OSCC vs. healthy control & poor prognosis OSCC vs. favorable prognosis OSCC |
(29,30) |
| HSP90AA1 |
0.028 |
1.3 |
0.029 |
Poor prognosis OSCC vs. favorable prognosis OSCC |
(29) |
| PKM |
0.035 |
1.3 |
0.036 |
Poor prognosis OSCC vs. favorable prognosis OSCC |
(29) |
| NPM1 |
0.039 |
1.3 |
0.04 |
Poor prognosis OSCC vs. favorable prognosis OSCC |
(29) |
| CCT2 |
0.044 |
1.3 |
0.044 |
Poor prognosis OSCC vs. favorable prognosis OSCC |
(29) |
| FASN |
0.044 |
1.3 |
0.045 |
Poor prognosis OSCC vs. favorable prognosis OSCC |
(29) |
| PRMT5 |
0.047 |
1.3 |
0.048 |
Poor prognosis OSCC vs. favorable prognosis OSCC |
(29) |
| GATA6 |
0.047 |
1.3 |
0.049 |
Poor prognosis OSCC vs. favorable prognosis OSCC |
(29) |
| SPRED3 |
0.049 |
1.3 |
0.049 |
Primary OSCC vs. healthy control |
(30) |
| BCL2L11 |
0.041 |
0.76 |
0.042 |
Primary OSCC vs. healthy control |
(30) |
| KAT2B |
0.034 |
0.75 |
0.035 |
Poor prognosis OSCC vs. favorable prognosis OSCC |
(29) |
| DDX6 |
0.037 |
0.75 |
0.037 |
Poor prognosis OSCC vs. favorable prognosis OSCC |
(29) |
| ESR1 |
0.024 |
0.74 |
0.025 |
Poor prognosis OSCC vs. favorable prognosis OSCC |
(29) |
| GAK |
0.03 |
0.74 |
0.031 |
Poor prognosis OSCC vs. favorable prognosis OSCC |
(29) |
| XRN1 |
0.021 |
0.73 |
0.021 |
Poor prognosis OSCC vs. favorable prognosis OSCC |
(29) |
| ARRB1 |
0.011 |
0.71 |
0.011 |
Poor prognosis OSCC vs. favorable prognosis OSCC |
(29) |
| GIGYF1 |
0.0041 |
0.68 |
0.0042 |
Primary OSCC vs. healthy control |
(30) |
| PIK3R3 |
0.00073 |
0.63 |
0.0008 |
Primary OSCC vs. healthy control |
(30) |
Note. HR: Hazard ratio; OSCC: Oral squamous cell carcinoma.
Table 2.
Prognostic Panels in OSCC
|
Prognostic Panel
|
P (Log-Rank Test)
|
HR (High)
|
P (HR)
|
Description of the Study Identifying which the Markers
|
Reference
|
| CALM1 + CYCS |
0.000033 |
1.8 |
0.000042 |
Primary OSCC vs. healthy control |
(30) |
| CALM1 + CYCS + THBS1 |
0.0015 |
1.5 |
0.0017 |
Primary OSCC vs. healthy control |
(30) |
| CALM1 + CYCS + THBS1 + MYC |
0.002 |
1.5 |
0.0022 |
Primary OSCC vs. healthy control |
(30) |
| CALM1 + CYCS + THBS1 + MYC + GATA6 |
0.0069 |
1.4 |
0.0072 |
Primary OSCC vs. healthy control |
(30) |
| CALM1 + CYCS + THBS1 + MYC + GATA6 + SPRED3 |
0.0011 |
1.6 |
0.0012 |
Primary OSCC vs. healthy control |
(30) |
| PIK3R3 + GIGYF1 |
0.021 |
0.73 |
0.022 |
Primary OSCC vs. healthy control |
(30) |
| PIK3R3 + GIGYF1 + BCL2L11 |
0.033 |
0.75 |
0.033 |
Primary OSCC vs. healthy control |
(30) |
Note. HR: Hazard ratio; OSCC: Oral squamous cell carcinoma.
Bayat et al (29) identified potential biomarkers associated with the prognosis of OSCC patients with poor prognosis and discovered differentially expressed miRNAs (DEMs) in OSCC patients with a poor prognosis compared to OSCC patients with a favorable prognosis. Subsequently, they constructed a protein interaction map (PIM) based on DEM targets. Finally, they identified hub markers within the PIM and evaluated their possible prognostic role in OSCC.
Likewise, Taherkhani et al (30) executed an integrated bioinformatics study to unravel potential biomarkers linked to primary OSCC compared to the healthy oral mucosa following the methods of Bayat et al (29). They indicated several prognostic markers and combined panels related to a dismal prognosis in OSCC patients.
Recommendation
It has been demonstrated that two genes called cytochrome c (CYCS) and Myc proto-oncogene protein (MYC) are more dysregulated in primary OSCC than in the healthy oral mucosa. They are also affected in OSCC patients with dismal prognoses compared to good prognoses. The hazard ratio (HZ) value for CYCS and MYC in patients with OSCC was calculated as 1.4 and 1.3, respectively. In this respect, the HZ value of the combination of these two genes was evaluated using the GEPIA2 web server (32), available at http://gepia2.cancer-pku.cn/#index. Interestingly, the combination of the genes elevated the HZ value to 1.5. Further, the log-rank test P value reached a more significant result of 0.0055 (Figure 1). Therefore, it is recommended that a combination of CYCS and MYC be used as a prognostic panel in patients with OSCC due to several reasons; CYCS and MYC are affected in primary OSCC and OSCC with a dismal prognosis, suggesting their critical role in the etiology of OSCC at any stage. Moreover, combining these genes leads to more accurate and reliable results than a single gene. Additionally, the HZ value is considerable.
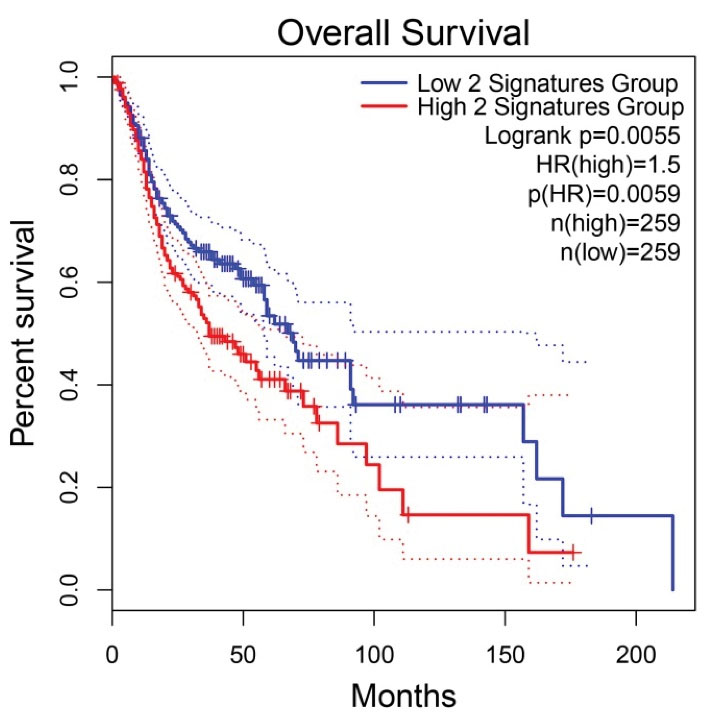
Figure 1.
Prognostic Roles of the Genes’ Signature, including CYCS and MYC, in Patients with OSCC. Note. CYCS: Cytochrome c; MYC: Myc proto-oncogene protein; OSCC, oral squamous cell carcinoma; HZ, hazard ratio. The X and Y axes demonstrate the survival time and probability in OSCC patients, respectively. The dotted lines represent 95% confidence intervals.
.
Prognostic Roles of the Genes’ Signature, including CYCS and MYC, in Patients with OSCC. Note. CYCS: Cytochrome c; MYC: Myc proto-oncogene protein; OSCC, oral squamous cell carcinoma; HZ, hazard ratio. The X and Y axes demonstrate the survival time and probability in OSCC patients, respectively. The dotted lines represent 95% confidence intervals.
The mitochondrial release of CYCS results in the caspase-3/caspase-9 signaling activation, leading to apoptosis process hyperactivation (32,33). It is hypothesized that the enhanced CYCS tissue expression is due to the elevated tumor mass in late OSCC compared to primary OSCC.
MYC (a well-known proto-oncogene) is an important transcription factor in signaling pathways, mediating cell growth and proliferation. This gene plays a critical role in tumor development and drug resistance in cancer therapy (34). In addition, it is upregulated in 80% of OSCC cases (35).
Acknowledgments
The authors would like to thank the Dental Research Center, the Deputy of Research and Technology, and Research Center for Molecular Medicine, Hamadan University of Medical Sciences, Hamadan-Iran for their support. This paper was extracted from a thesis submitted by Golnaz Moradifar and Shahab Moradi Dehto.
Availability of Data and Materials
The datasets used and/or analyzed during the current study are available from the corresponding author upon reasonable request.
Competing Interests
The authors declare that they have no competing interests.
Consent for Publication
Not applicable.
Ethical Approval
The current study was approved by the Ethics Committee of Hamadan University of Medical Sciences, Hamadan, Iran (Ethics No. IR.UMSHA.REC.1400.315 and IR.UMSHA.REC.1399.983).
Funding
This research received no specific grant from any funding agency in the public, commercial, or not-for-profit sectors.
References
- Liu C, Wang M, Zhang H, Li C, Zhang T, Liu H. Tumor microenvironment and immunotherapy of oral cancer. Eur J Med Res 2022; 27(1):198. doi: 10.1186/s40001-022-00835-4 [Crossref] [ Google Scholar]
- Ling Z, Cheng B, Tao X. Epithelial-to-mesenchymal transition in oral squamous cell carcinoma: challenges and opportunities. Int J Cancer 2021; 148(7):1548-61. doi: 10.1002/ijc.33352 [Crossref] [ Google Scholar]
- Siegel RL, Miller KD, Jemal A. Cancer statistics, 2019. CA Cancer J Clin 2019; 69(1):7-34. doi: 10.3322/caac.21551 [Crossref] [ Google Scholar]
- Bray F, Ferlay J, Soerjomataram I, Siegel RL, Torre LA, Jemal A. Global cancer statistics 2018: GLOBOCAN estimates of incidence and mortality worldwide for 36 cancers in 185 countries. CA Cancer J Clin 2018; 68(6):394-424. doi: 10.3322/caac.21492 [Crossref] [ Google Scholar]
- Li Y, Li L-J, Zhao H-W, Han B, Lang J-Y. Clinical evaluation on controlling postoperative recurrence of oral squamous cell carcinoma by intracavity brachytherapy. Int J Oral Maxillofac Surg 2009; 38(8):840-5. doi: 10.1016/j.ijom.2009.03.707 [Crossref] [ Google Scholar]
- Ho AS, Kim S, Tighiouart M, Gudino C, Mita A, Scher KS. Metastatic lymph node burden and survival in oral cavity cancer. J Clin Oncol 2017; 35(31):3601-9. doi: 10.1200/jco.2016.71.1176 [Crossref] [ Google Scholar]
- Dave K, Ali A, Magalhaes M. Increased expression of PD-1 and PD-L1 in oral lesions progressing to oral squamous cell carcinoma: a pilot study. Sci Rep 2020; 10(1):9705. doi: 10.1038/s41598-020-66257-6 [Crossref] [ Google Scholar]
- Zhai J, Luo G. GATA6-induced FN1 activation promotes the proliferation, invasion and migration of oral squamous cell carcinoma cells. Mol Med Rep 2022; 25(3):102. doi: 10.3892/mmr.2022.12618 [Crossref] [ Google Scholar]
- Xiao M, Zhang J, Chen W, Chen W. M1-like tumor-associated macrophages activated by exosome-transferred THBS1 promote malignant migration in oral squamous cell carcinoma. J Exp Clin Cancer Res 2018; 37(1):143. doi: 10.1186/s13046-018-0815-2 [Crossref] [ Google Scholar]
- Wang Z, Yan J, Zou T, Gao H. MicroRNA-1294 inhibited oral squamous cell carcinoma growth by targeting c-Myc. Oncol Lett 2018; 16(2):2243-50. doi: 10.3892/ol.2018.8967 [Crossref] [ Google Scholar]
- Ries LAG, Eisner MP, Kosary CL, Hankey BF, Miller BA, Clegg L, et al. SEER Cancer Statistics Review, 1975-2002. Bethesda, MD: National Cancer Institute; 2002. https://seer.cancer.gov/csr/1975_2002/.
- Torabi M, Haghani J, Alsadat Hashemipour M, Ebrahimi M. Mast cells density in hyperkeratosis, dysplastic oral mucosa and oral squamous cell carcinoma. Avicenna J Dent Res 2018; 10(2):67-70. doi: 10.34172/ajdr.2018.15 [Crossref] [ Google Scholar]
- Bu W, Wang Z, Meng L, Li X, Liu X, Chen Y. Disulfiram inhibits epithelial-mesenchymal transition through TGFβ-ERK-Snail pathway independently of Smad4 to decrease oral squamous cell carcinoma metastasis. Cancer Manag Res 2019; 11:3887-98. doi: 10.2147/cmar.s199912 [Crossref] [ Google Scholar]
- Jemal A, Siegel R, Ward E, Hao Y, Xu J, Murray T. Cancer statistics, 2008. CA Cancer J Clin 2008; 58(2):71-96. doi: 10.3322/ca.2007.0010 [Crossref] [ Google Scholar]
- Warnakulasuriya S. Causes of oral cancer--an appraisal of controversies. Br Dent J 2009; 207(10):471-5. doi: 10.1038/sj.bdj.2009.1009 [Crossref] [ Google Scholar]
- Eckert AW, Kappler M, Schubert J, Taubert H. Correlation of expression of hypoxia-related proteins with prognosis in oral squamous cell carcinoma patients. Oral Maxillofac Surg 2012; 16(2):189-96. doi: 10.1007/s10006-012-0335-8 [Crossref] [ Google Scholar]
- Liu K, Wang X, Li D, Xu D, Li D, Lv Z. Ginkgolic acid, a SUMO-1 inhibitor, inhibits the progression of oral squamous cell carcinoma by alleviating SUMOylation of Smad4. Mol Ther Oncolytics 2020; 16:86-99. doi: 10.1016/j.omto.2019.12.005 [Crossref] [ Google Scholar]
- Silverman S Jr. Demographics and occurrence of oral and pharyngeal cancers the outcomes, the trends, the challenge. J Am Dent Assoc 2001; 132 Suppl:7S-11S. doi: 10.14219/jada.archive.2001.0382 [Crossref] [ Google Scholar]
- Auzair LB, Vincent-Chong VK, Ghani WM, Kallarakkal TG, Ramanathan A, Lee CE. Caveolin 1 (Cav-1) and actin-related protein 2/3 complex, subunit 1B (ARPC1B) expressions as prognostic indicators for oral squamous cell carcinoma (OSCC). Eur Arch Otorhinolaryngol 2016; 273(7):1885-93. doi: 10.1007/s00405-015-3703-9 [Crossref] [ Google Scholar]
- Rot S, Kaune T, Taubert H, Greither T, Kotrba J, Güttler A. Prognostic impact of mRNA levels of LGR5 transcript variants in OSCC patients. BMC Cancer 2019; 19(1):155. doi: 10.1186/s12885-019-5327-8 [Crossref] [ Google Scholar]
- Tyagi A, Gu M, Takahata T, Frederick B, Agarwal C, Siriwardana S. Resveratrol selectively induces DNA Damage, independent of Smad4 expression, in its efficacy against human head and neck squamous cell carcinoma. Clin Cancer Res 2011; 17(16):5402-11. doi: 10.1158/1078-0432.ccr-11-1072 [Crossref] [ Google Scholar]
- Heo K, Kim YH, Sung HJ, Li HY, Yoo CW, Kim JY. Hypoxia-induced up-regulation of apelin is associated with a poor prognosis in oral squamous cell carcinoma patients. Oral Oncol 2012; 48(6):500-6. doi: 10.1016/j.oraloncology.2011.12.015 [Crossref] [ Google Scholar]
- Mishra A, Verma M. Cancer biomarkers: are we ready for the prime time?. Cancers (Basel) 2010; 2(1):190-208. doi: 10.3390/cancers2010190 [Crossref] [ Google Scholar]
- Rivera C, Oliveira AK, Costa RAP, De Rossi T, Paes Leme AF. Prognostic biomarkers in oral squamous cell carcinoma: a systematic review. Oral Oncol 2017; 72:38-47. doi: 10.1016/j.oraloncology.2017.07.003 [Crossref] [ Google Scholar]
- Mahfouz ME, Rodrigo JP, Takes RP, Elsheikh MN, Rinaldo A, Brakenhoff RH. Current potential and limitations of molecular diagnostic methods in head and neck cancer. Eur Arch Otorhinolaryngol 2010; 267(6):851-60. doi: 10.1007/s00405-009-1177-3 [Crossref] [ Google Scholar]
- Ai Y, Wu S, Zou C, Wei H. LINC00941 promotes oral squamous cell carcinoma progression via activating CAPRIN2 and canonical WNT/β-catenin signaling pathway. J Cell Mol Med 2020; 24(18):10512-24. doi: 10.1111/jcmm.15667 [Crossref] [ Google Scholar]
- Grimminger CM, Danenberg PV. Update of prognostic and predictive biomarkers in oropharyngeal squamous cell carcinoma: a review. Eur Arch Otorhinolaryngol 2011; 268(1):5-16. doi: 10.1007/s00405-010-1369-x [Crossref] [ Google Scholar]
- Li J, Wang Y, Wang X, Yang Q. CDK1 and CDC20 overexpression in patients with colorectal cancer are associated with poor prognosis: evidence from integrated bioinformatics analysis. World J Surg Oncol 2020; 18(1):50. doi: 10.1186/s12957-020-01817-8 [Crossref] [ Google Scholar]
- Bayat Z, Farhadi Z, Taherkhani A. Identification of potential biomarkers associated with poor prognosis in oral squamous cell carcinoma through integrated bioinformatics analysis: a pilot study. Gene Rep 2021; 24:101243. doi: 10.1016/j.genrep.2021.101243 [Crossref] [ Google Scholar]
- Taherkhani A, Dehto SS, Jamshidi S, Shojaei S. Pathogenesis and prognosis of primary oral squamous cell carcinoma based on microRNAs target genes: a systems biology approach. Genomics Inform 2022; 20(3):e27. doi: 10.5808/gi.22038 [Crossref] [ Google Scholar]
- Taherkhani A, Nafar M, Arefi-Oskouie A, Broumandnia N, Parvin M, Mahmoudieh L. Metabolomic analysis of membranous glomerulonephritis: identification of a diagnostic panel and pathogenic pathways. Arch Med Res 2019; 50(4):159-69. doi: 10.1016/j.arcmed.2019.08.004 [Crossref] [ Google Scholar]
- Adrain C, Martin SJ. The mitochondrial apoptosome: a killer unleashed by the cytochrome seas. Trends Biochem Sci 2001; 26(6):390-7. doi: 10.1016/s0968-0004(01)01844-8 [Crossref] [ Google Scholar]
- Hengartner MO. The biochemistry of apoptosis. Nature 2000; 407(6805):770-6. doi: 10.1038/35037710 [Crossref] [ Google Scholar]
- Donati G, Amati B. MYC and therapy resistance in cancer: risks and opportunities. Mol Oncol 2022; 16(21):3828-54. doi: 10.1002/1878-0261.13319 [Crossref] [ Google Scholar]
- Pai R, Pai S, Lalitha R, Kumaraswamy S, Lalitha N, Johnston R. Over-expression of c-Myc oncoprotein in oral squamous cell carcinoma in the South Indian population. Ecancermedicalscience 2009; 3:128. doi: 10.3332/ecancer.2008.128 [Crossref] [ Google Scholar]